Free Access
Fig. 4
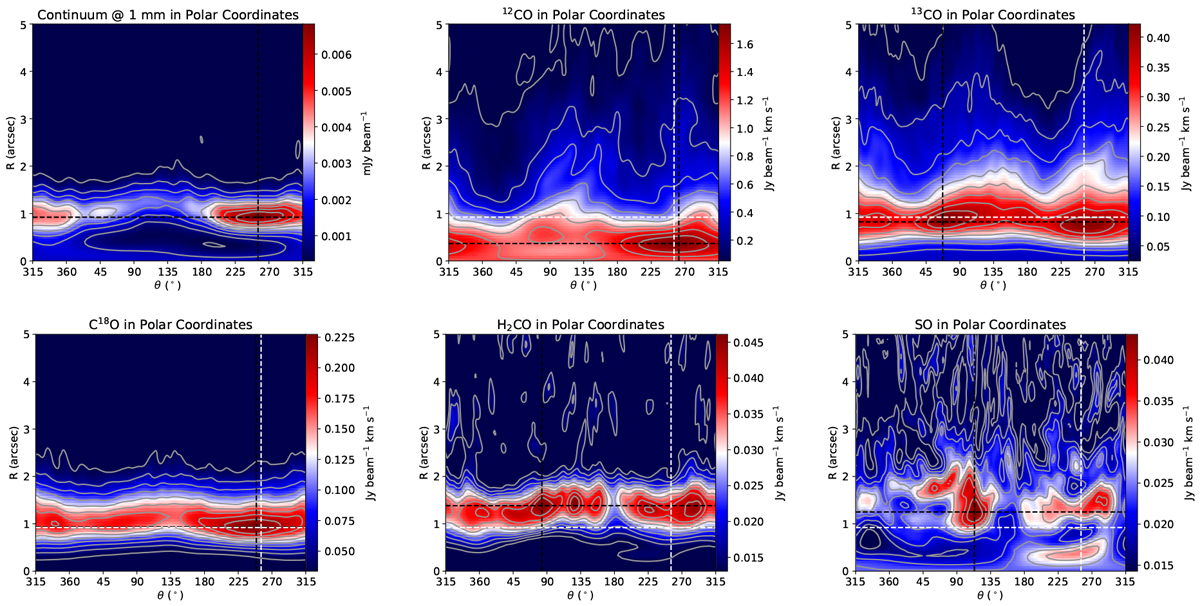
De-projected integrated intensity maps in polar coordinates. Top left: continuum emission. The black dashed lines depicts the position of the continuum peak. In the rest of the panels, the white dashed lines depict the position of the continuum peak, while the black dashed lines depict the peak of each species.
Current usage metrics show cumulative count of Article Views (full-text article views including HTML views, PDF and ePub downloads, according to the available data) and Abstracts Views on Vision4Press platform.
Data correspond to usage on the plateform after 2015. The current usage metrics is available 48-96 hours after online publication and is updated daily on week days.
Initial download of the metrics may take a while.