Fig. 3
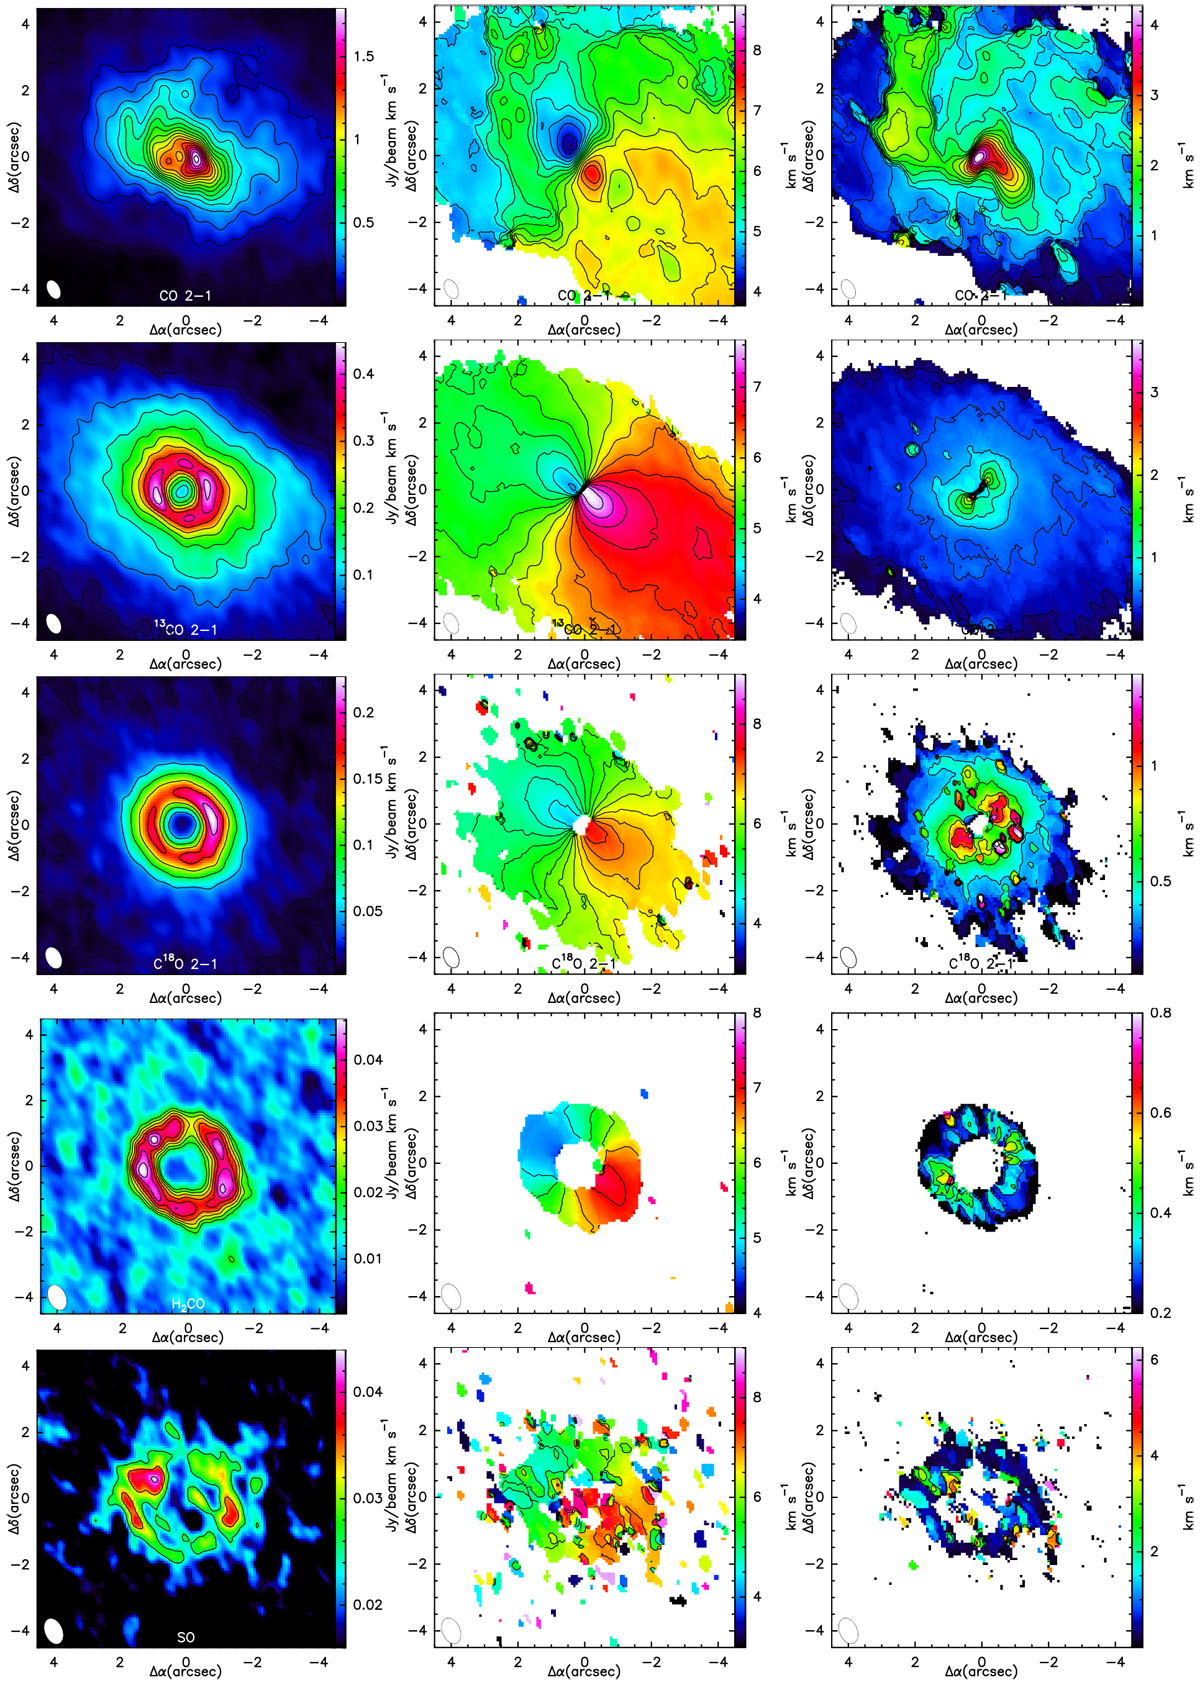
Zeroth-, first-, and second-moment maps of the different species surveyed with NOEMA. Left: tntegrated intensity maps (zeroth-moment maps). Center: intensity-weighted velocity maps (first-moment maps). Right: velocity dispersion maps (second-moment maps). From top to bottom: species are 12CO, 13CO, C18O, H2CO, and SO. The maps were obtained after integrating channels in the range 3–9 km s−1. For the first- and second-moment maps, only channels with a S∕N > 5 were used.The white ellipses in the bottom left corner of each map depict the synthesized beam at each wavelength.
Current usage metrics show cumulative count of Article Views (full-text article views including HTML views, PDF and ePub downloads, according to the available data) and Abstracts Views on Vision4Press platform.
Data correspond to usage on the plateform after 2015. The current usage metrics is available 48-96 hours after online publication and is updated daily on week days.
Initial download of the metrics may take a while.