Fig. 10
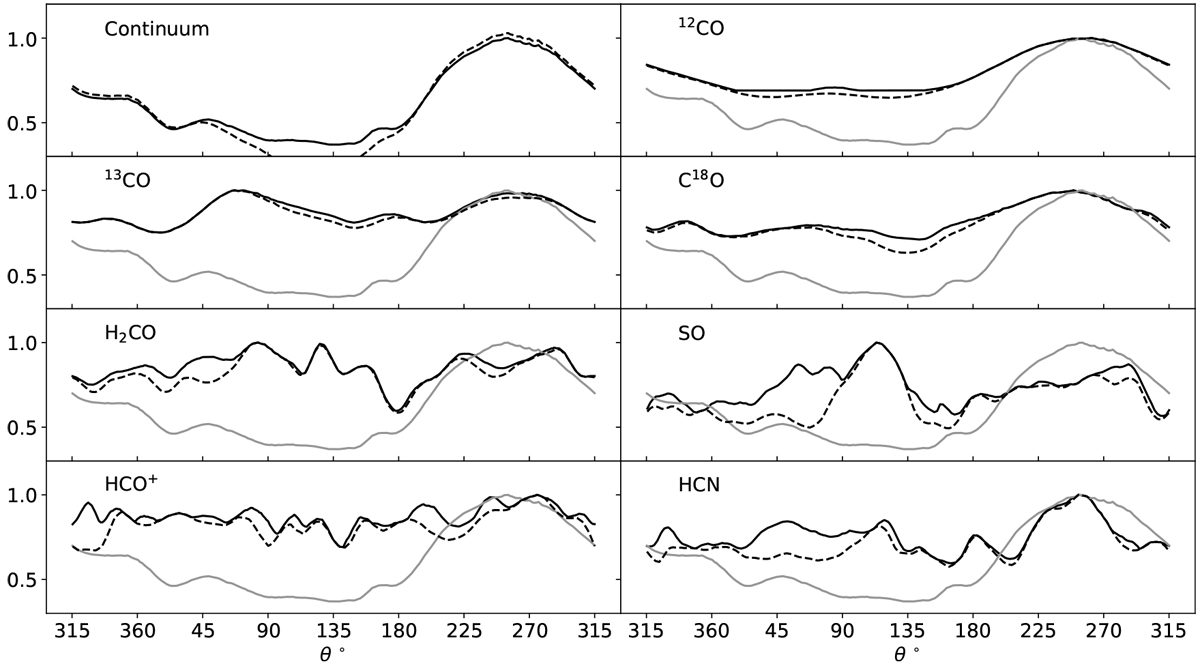
Cutsalong the azimuth of the intensity normalized to its maximum value for the continuum emission and the different species surveyed after de-projection. The black solid line depicts the cut at the radial distance of the emission peak. The black dashed line depicts the cut along the crescent (see text). The grey line depicts the continuum azimuthal cut along the maximum.
Current usage metrics show cumulative count of Article Views (full-text article views including HTML views, PDF and ePub downloads, according to the available data) and Abstracts Views on Vision4Press platform.
Data correspond to usage on the plateform after 2015. The current usage metrics is available 48-96 hours after online publication and is updated daily on week days.
Initial download of the metrics may take a while.