Fig. 1
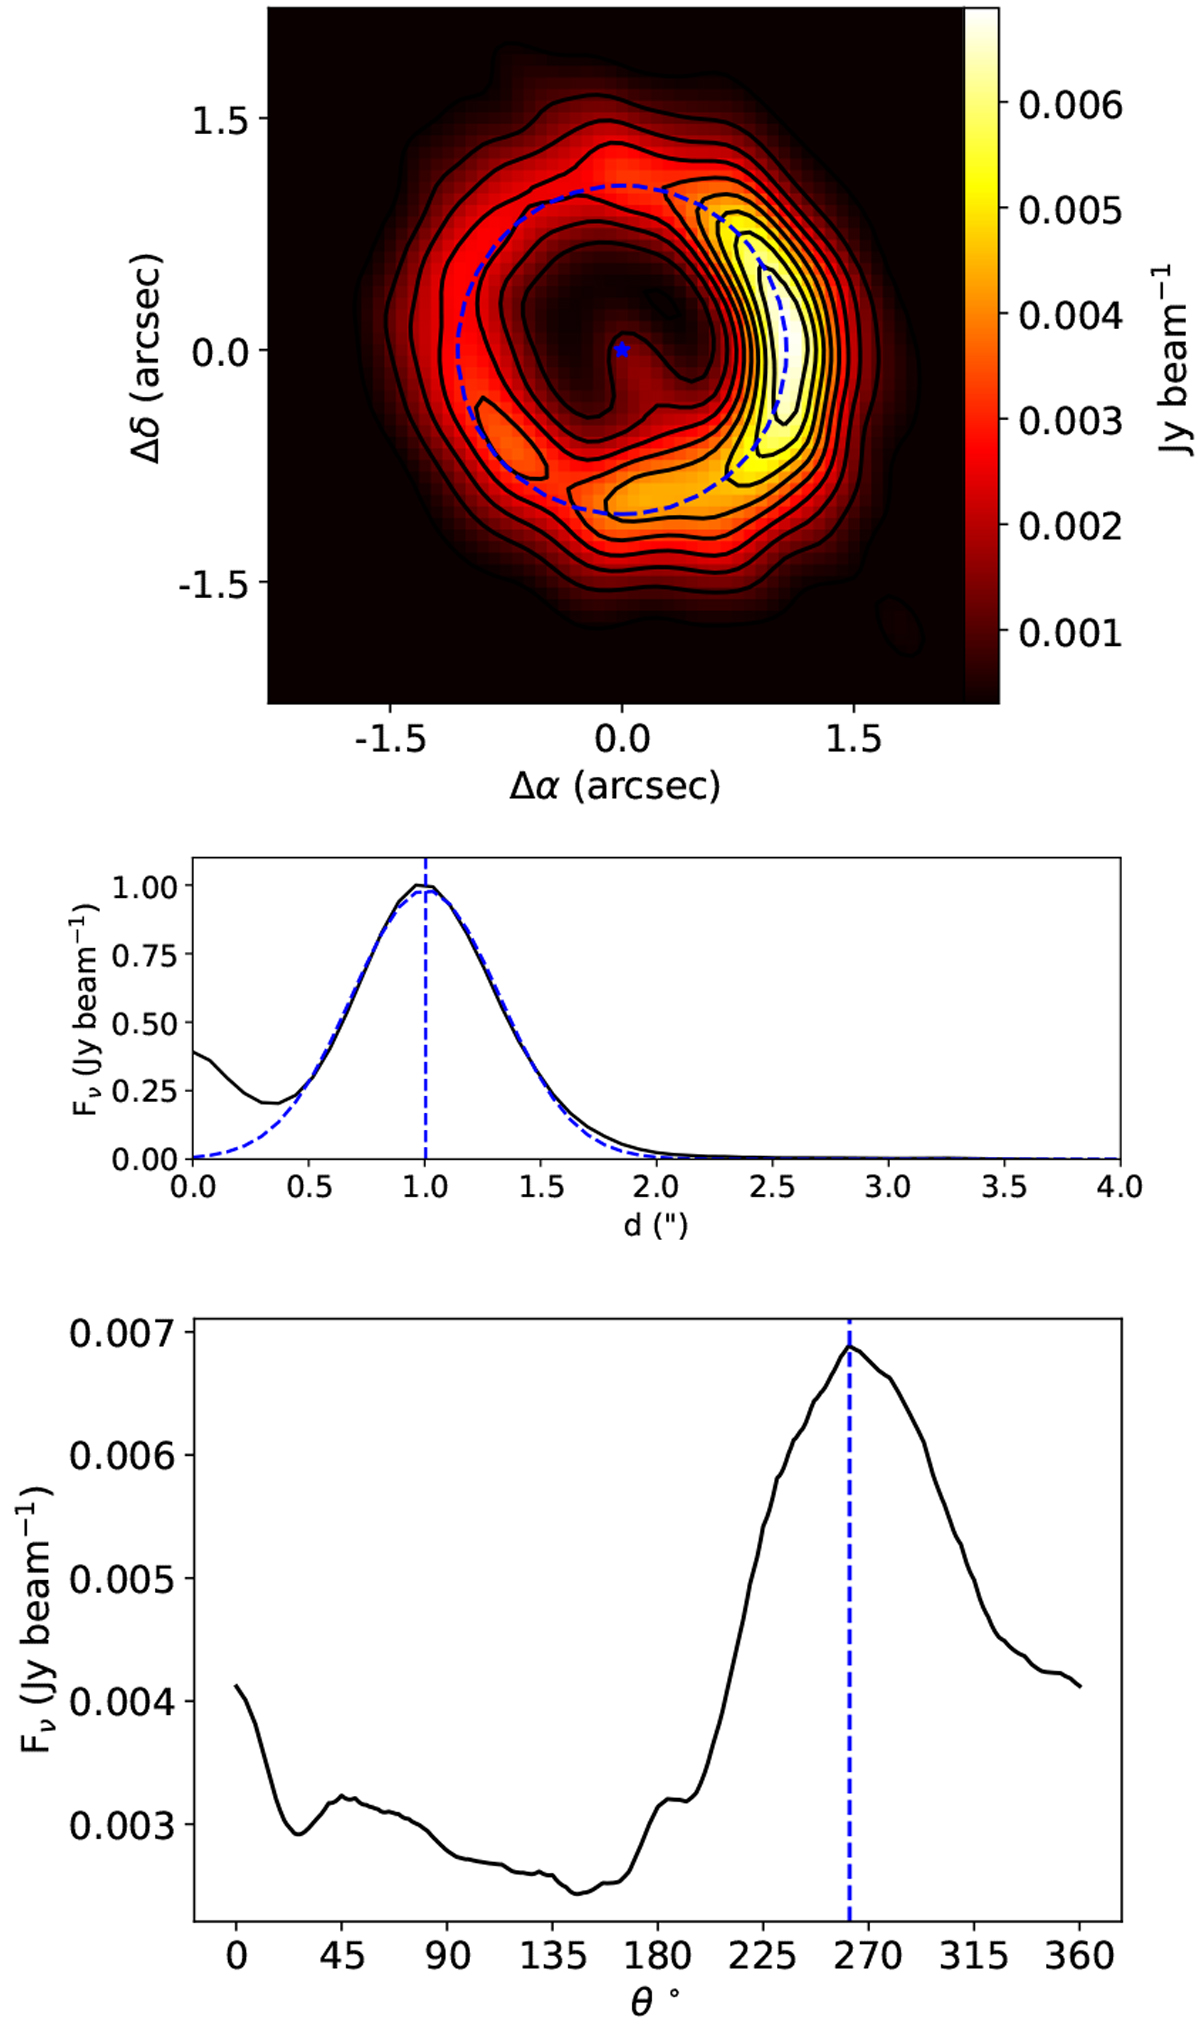
Top: continuum intensity map. The blue dashed circle marks the position of the maximum in the radial direction, and the blue star marks the position of the centroid of the ellipse used to compute the inclination angle. Middle: azimuthally averaged radial profile of continuum intensity map. The blue dashed curve shows a Gaussian fit to the profile. The blue dashed vertical line marks the position of the maximum in the radial direction. Bottom: azimuthal cut along the radius of maximum intensity. The blue dashed vertical line marks the position of the maximum in the azimuthal direction.
Current usage metrics show cumulative count of Article Views (full-text article views including HTML views, PDF and ePub downloads, according to the available data) and Abstracts Views on Vision4Press platform.
Data correspond to usage on the plateform after 2015. The current usage metrics is available 48-96 hours after online publication and is updated daily on week days.
Initial download of the metrics may take a while.