Fig. 5.
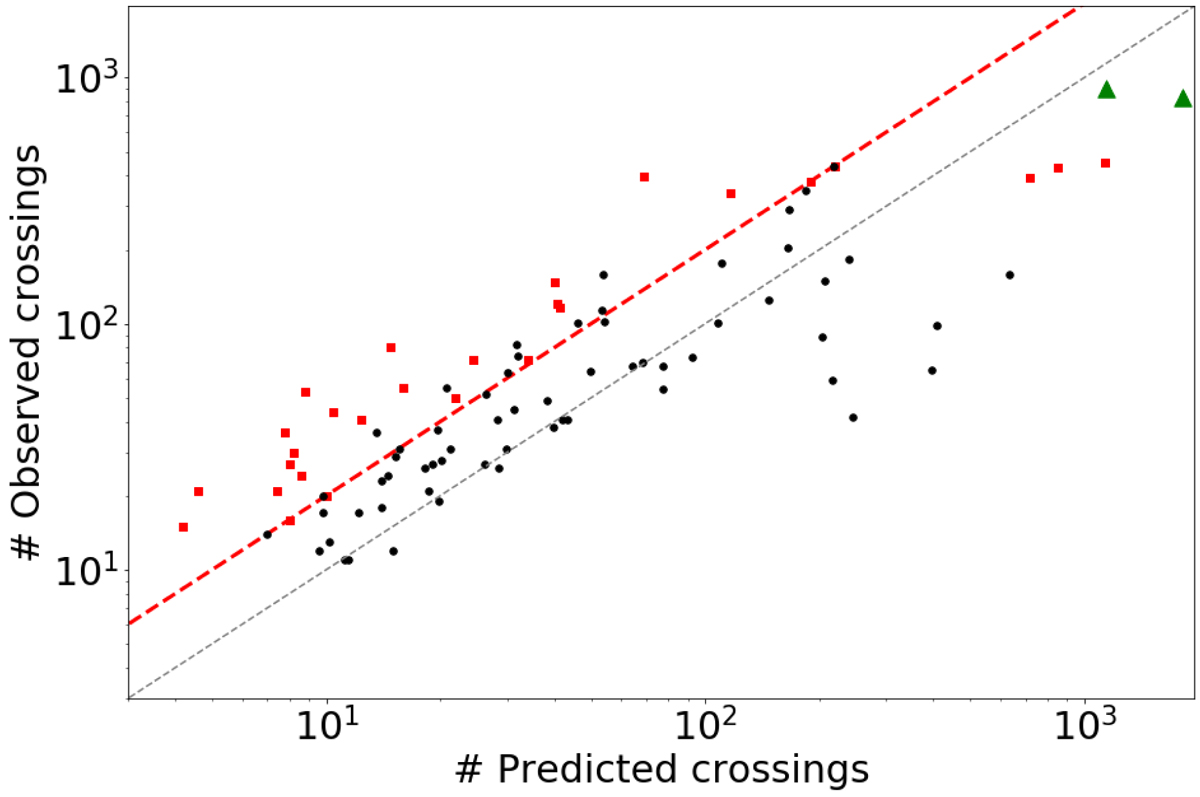
Observed number of zero crossings as a function of the predicted number of crossings for all 90 variables. The two g-mode hot subdwarf pulsators are shown as green triangles. The two dashed lines represent equality (bottom, in grey) and observed number of crossings equal to twice the number of predicted crossings (top, in red). Objects not included as rotational variables are shown as red squares. Objects with a high number of predicted crossings due to showing short periods often show less observed crossings because TESS data is not continuous, presenting a gap every ≃13 days when data was being transmitted to Earth.
Current usage metrics show cumulative count of Article Views (full-text article views including HTML views, PDF and ePub downloads, according to the available data) and Abstracts Views on Vision4Press platform.
Data correspond to usage on the plateform after 2015. The current usage metrics is available 48-96 hours after online publication and is updated daily on week days.
Initial download of the metrics may take a while.