Fig. 3.
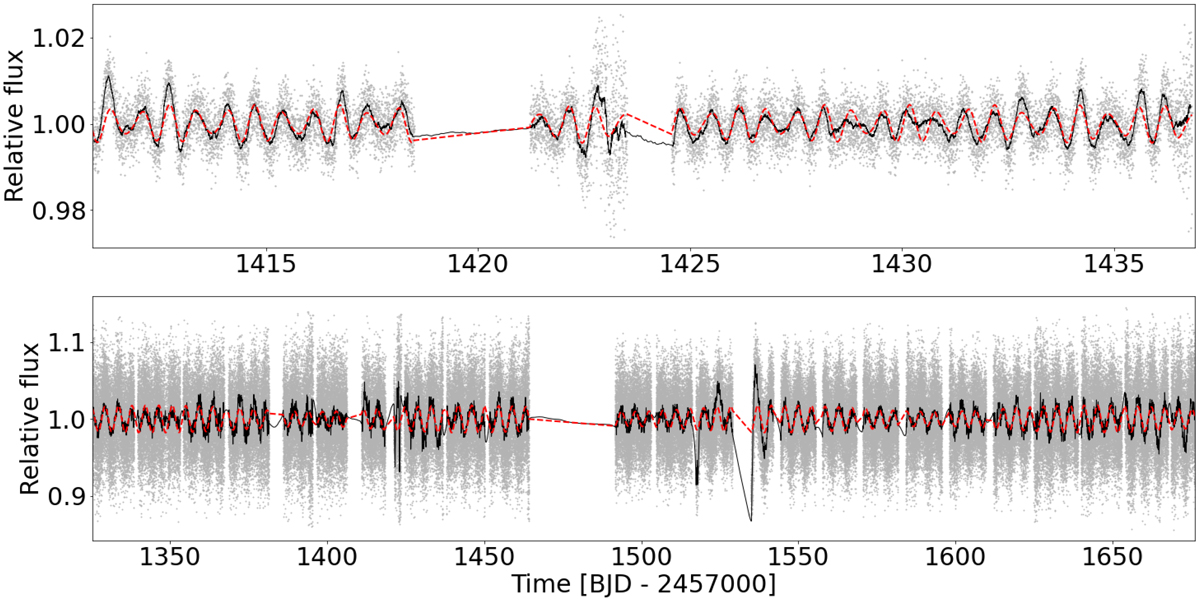
TIC 12528447 (top) and TIC 382518318 (bottom), two systems for which the variability has been attributed to rotation of the main sequence companion. The former was observed in only one sector, while the latter is in the TESS continuous viewing zone and has 2 min cadence data for 12 sectors. The grey dots are the TESS data, the black line is a running mean every 50 points, and the dashed red line is the multi-component fit.
Current usage metrics show cumulative count of Article Views (full-text article views including HTML views, PDF and ePub downloads, according to the available data) and Abstracts Views on Vision4Press platform.
Data correspond to usage on the plateform after 2015. The current usage metrics is available 48-96 hours after online publication and is updated daily on week days.
Initial download of the metrics may take a while.