Fig. 1.
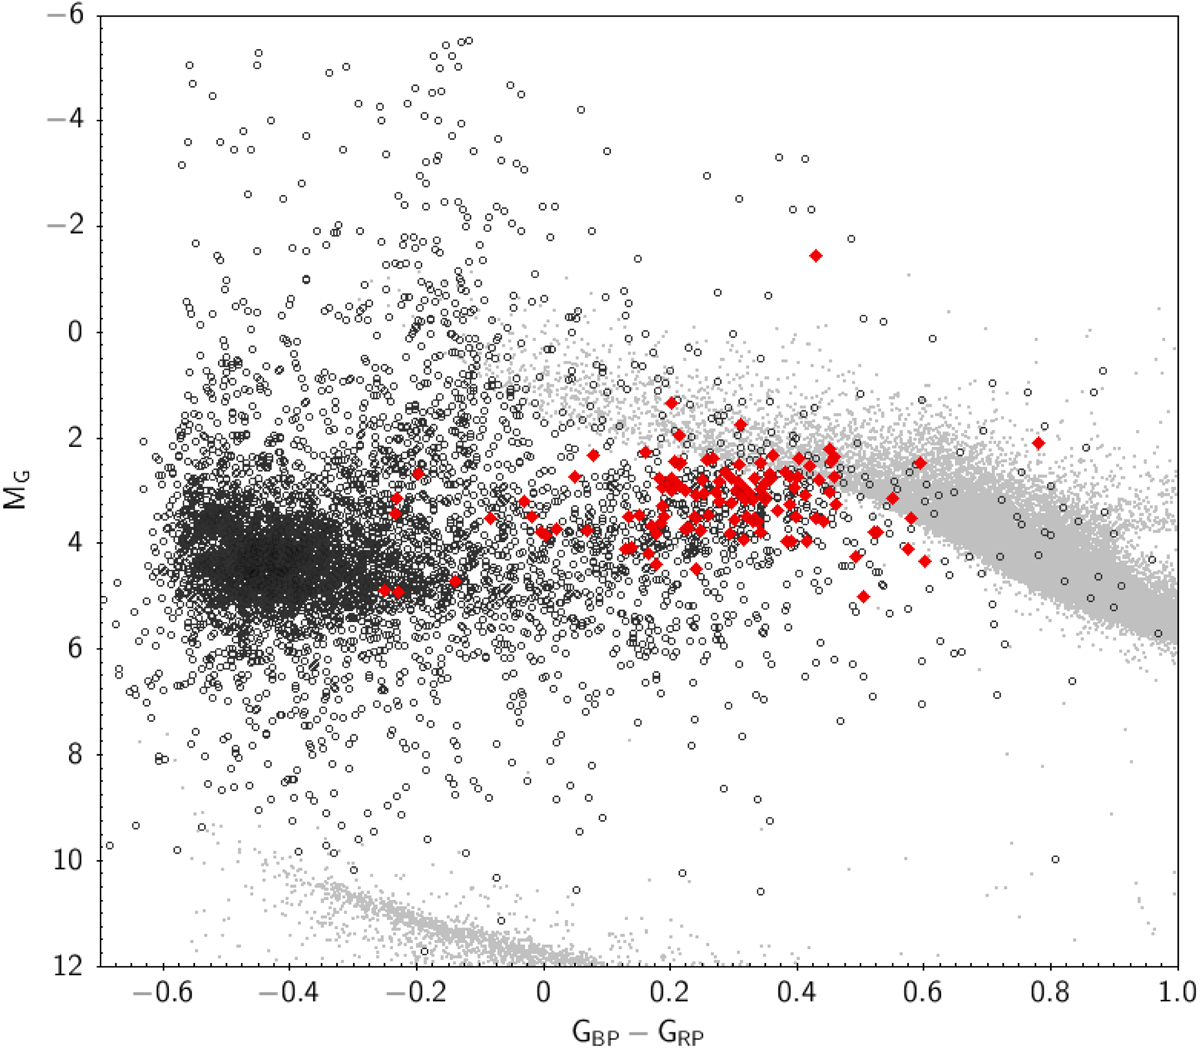
Colour-magnitude diagram showing all stars from the catalogue of Geier (2020) as dark grey circles. The composite systems analysed in this work are shown as red diamonds. At this point, no quality cuts have been performed in the astrometry, which explains the high spread. Sample C of Lindegren et al. (2018) is shown in light grey to facilitate the location of the main sequence and other evolutionary stages.
Current usage metrics show cumulative count of Article Views (full-text article views including HTML views, PDF and ePub downloads, according to the available data) and Abstracts Views on Vision4Press platform.
Data correspond to usage on the plateform after 2015. The current usage metrics is available 48-96 hours after online publication and is updated daily on week days.
Initial download of the metrics may take a while.