Open Access
Fig. 7
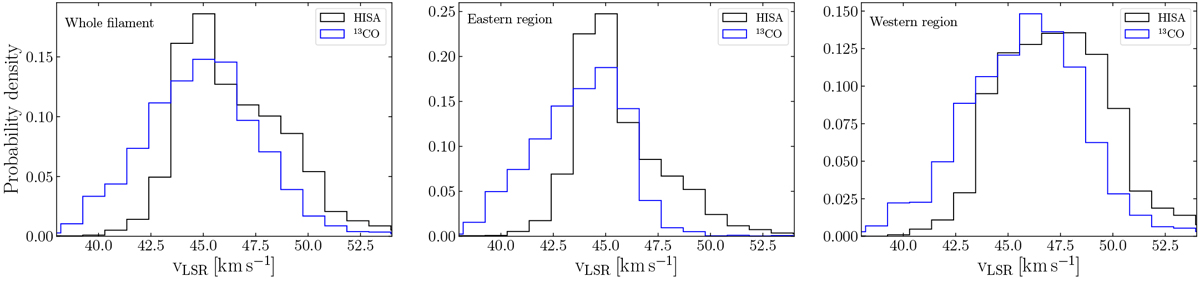
Histogram of peak velocities. The histograms show the peak velocities of HISA and 13CO in black andblue, respectively. Middle and right panels: velocity distribution in the regions marked by the left and right polygon in Fig. 6, respectively.
Current usage metrics show cumulative count of Article Views (full-text article views including HTML views, PDF and ePub downloads, according to the available data) and Abstracts Views on Vision4Press platform.
Data correspond to usage on the plateform after 2015. The current usage metrics is available 48-96 hours after online publication and is updated daily on week days.
Initial download of the metrics may take a while.