Fig. 5
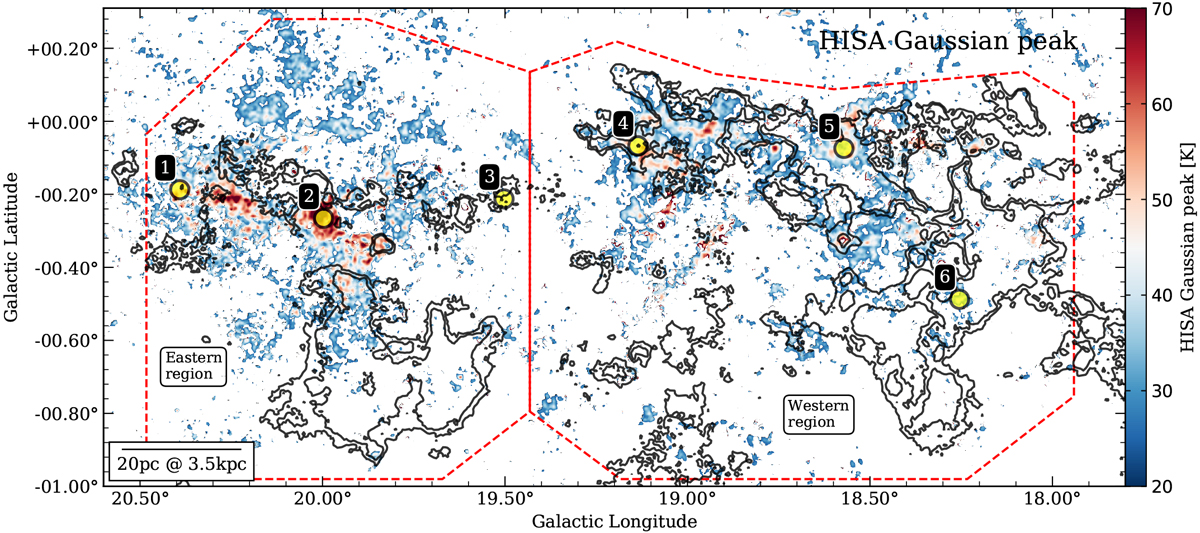
Peak values of a Gaussian fit applied to the estimated HISA spectra. This panel presents the fitted peak values of the extracted HISA spectra. The spectra have been fitted with a single-component Gaussian curve. The black contours represent the integrated 13CO emission from 42 to 57 km s−1 at levels of 10.5 and 15 K km s−1. The red dashed polygons define the eastern and western part of the filament. The yellow circles mark the regions of the spectra shown in Fig. 4.
Current usage metrics show cumulative count of Article Views (full-text article views including HTML views, PDF and ePub downloads, according to the available data) and Abstracts Views on Vision4Press platform.
Data correspond to usage on the plateform after 2015. The current usage metrics is available 48-96 hours after online publication and is updated daily on week days.
Initial download of the metrics may take a while.