Fig. 3
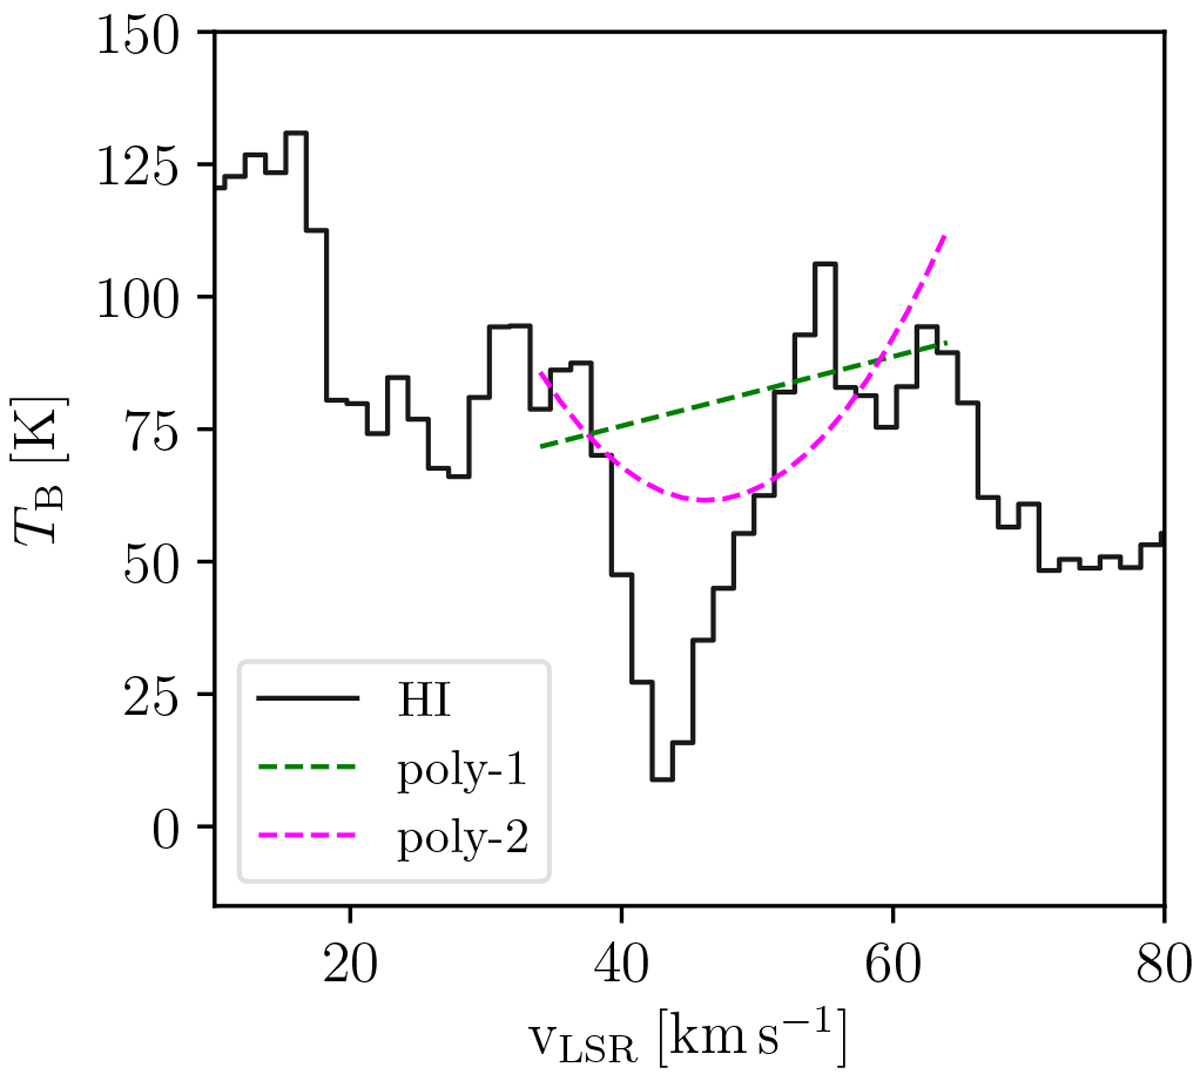
Comparison of baseline fits toward continuum emission. The black curve shows an example spectrum of H I emission centered in ℓ = 18.95°, b = − 0.03° that is contaminated by continuum emission. The dashed magenta and green curve show a second and first order polynomial fit to the velocity channels of the H I spectrum at 33.5–43.0 and 56.0–65.5 km s−1, respectively.Due to the continuum contamination, the second order polynomial yields a bad fit to the HISA baseline.
Current usage metrics show cumulative count of Article Views (full-text article views including HTML views, PDF and ePub downloads, according to the available data) and Abstracts Views on Vision4Press platform.
Data correspond to usage on the plateform after 2015. The current usage metrics is available 48-96 hours after online publication and is updated daily on week days.
Initial download of the metrics may take a while.