Fig. 2
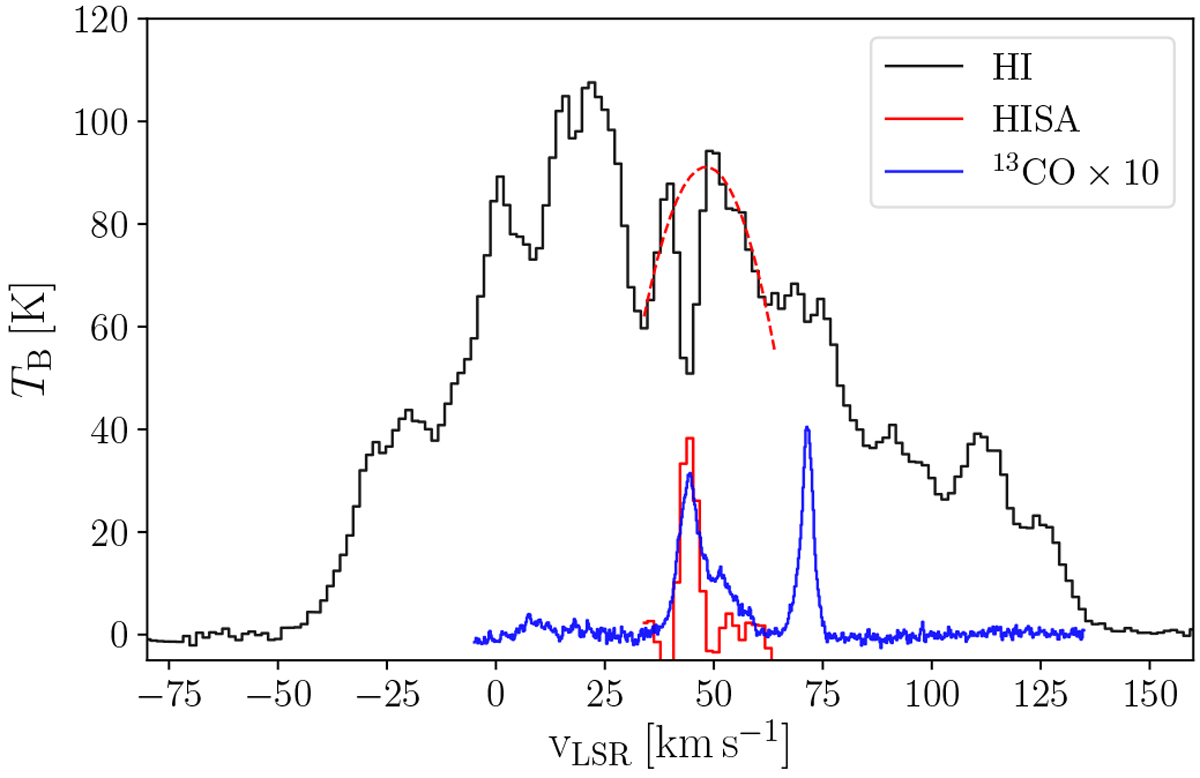
H I, HISA, and 13CO spectra. The black curve shows an example spectrum of H I emission (Ton) from −80 to 160 km s−1 averaged over an area of 180′′ × 180′′ centered in ℓ = 19.9°, b = −0.5°. The dashed red curve is a second-order polynomial fit (Toff) to the absorption-free channels of the H I spectrum at 33.5–43.0 and 56.0–65.5 km s−1 (see Sect. 2.2). We estimated the HISA spectrum by then subtracting the H I spectra from the fitted background emission. The GRS 13CO spectrum (Jackson et al. 2006) covering velocities from −5 to 135 km s−1 is shown in blue and has been multiplied by a factor of ten for better visibility.
Current usage metrics show cumulative count of Article Views (full-text article views including HTML views, PDF and ePub downloads, according to the available data) and Abstracts Views on Vision4Press platform.
Data correspond to usage on the plateform after 2015. The current usage metrics is available 48-96 hours after online publication and is updated daily on week days.
Initial download of the metrics may take a while.