Fig. A.1
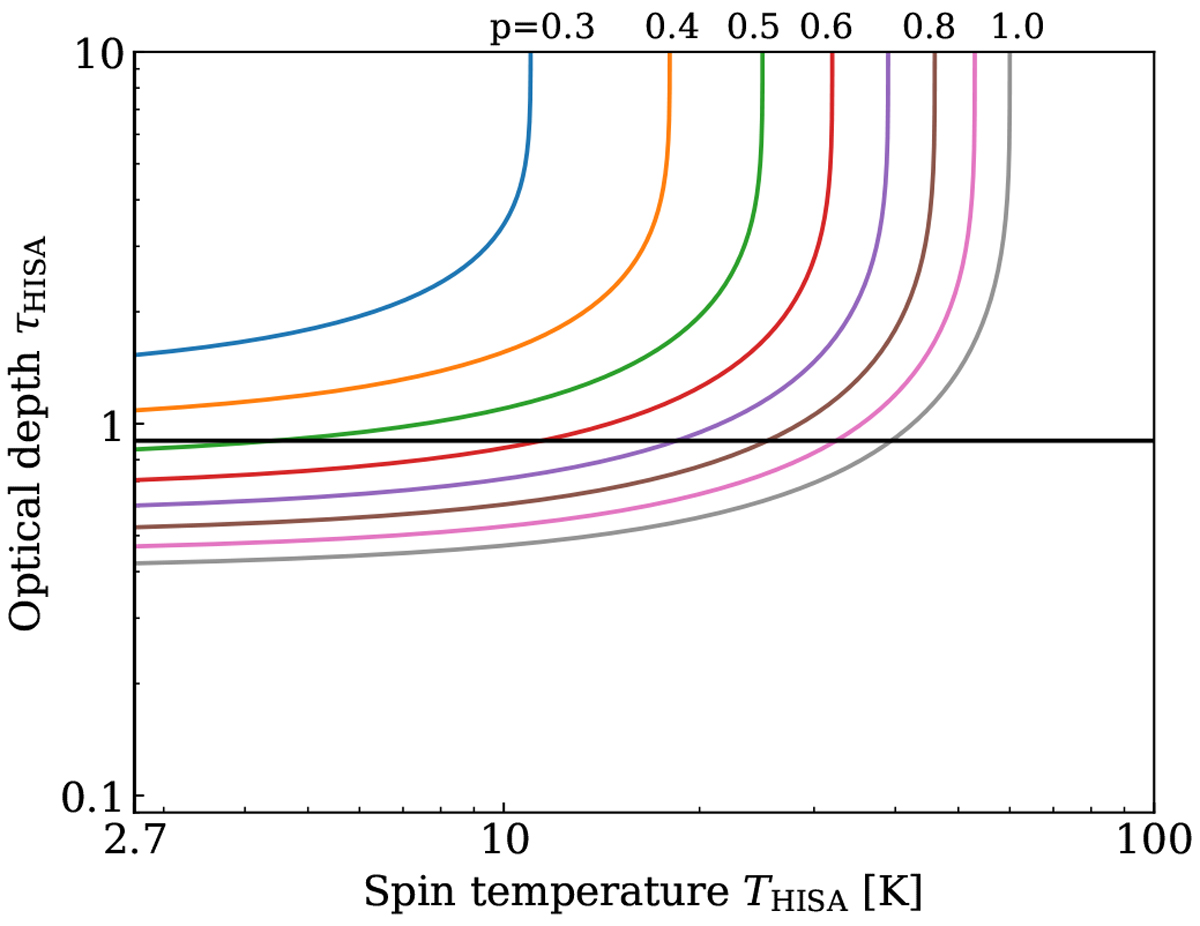
Optical depth τHISA as a functionof spin temperature THISA at the derived mean temperatures of Ton = 40 K, Toff = 70 K, and Tcont = 20 K (Eq. (1)). The different colors represent varying background fractions p, with values from 0.3 to 1.0. The horizontal black line marks an optical depth of 0.9 that was determined from H I absorption against strong continuum emission.
Current usage metrics show cumulative count of Article Views (full-text article views including HTML views, PDF and ePub downloads, according to the available data) and Abstracts Views on Vision4Press platform.
Data correspond to usage on the plateform after 2015. The current usage metrics is available 48-96 hours after online publication and is updated daily on week days.
Initial download of the metrics may take a while.