Fig. 14
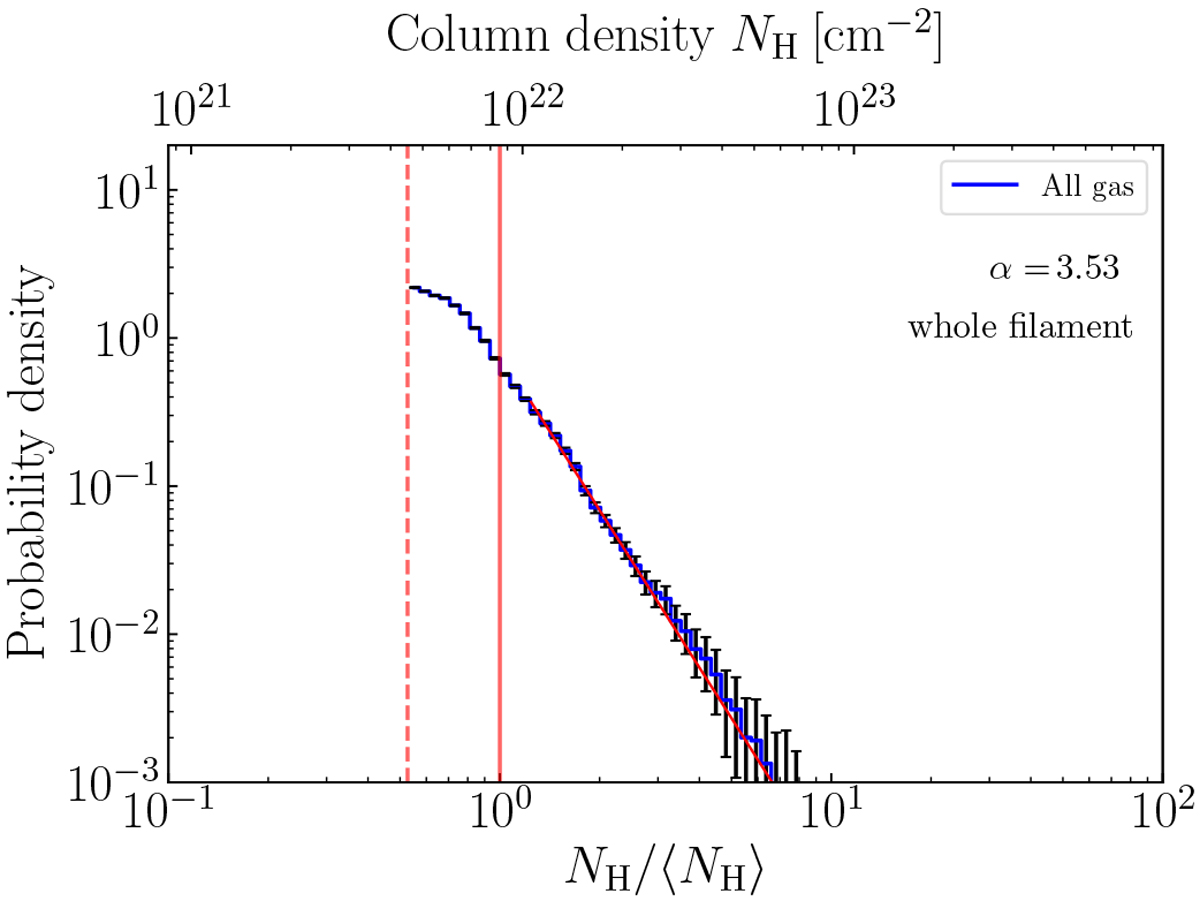
All gas N-PDF of GMF20.0-17.9. The PDF is derived by adding the column densities of H I, HISA, and H2. The plot shows the derived N-PDF of the whole filament marked by both the red polygons in Fig. 11. The red vertical dashed and solid line marks the column density threshold (last closed contour) at 4.5 × 1021 cm−2 and mean column density, respectively. The red solid line indicates the power-law fit to the high column density tail of the distribution.
Current usage metrics show cumulative count of Article Views (full-text article views including HTML views, PDF and ePub downloads, according to the available data) and Abstracts Views on Vision4Press platform.
Data correspond to usage on the plateform after 2015. The current usage metrics is available 48-96 hours after online publication and is updated daily on week days.
Initial download of the metrics may take a while.