Fig. 12
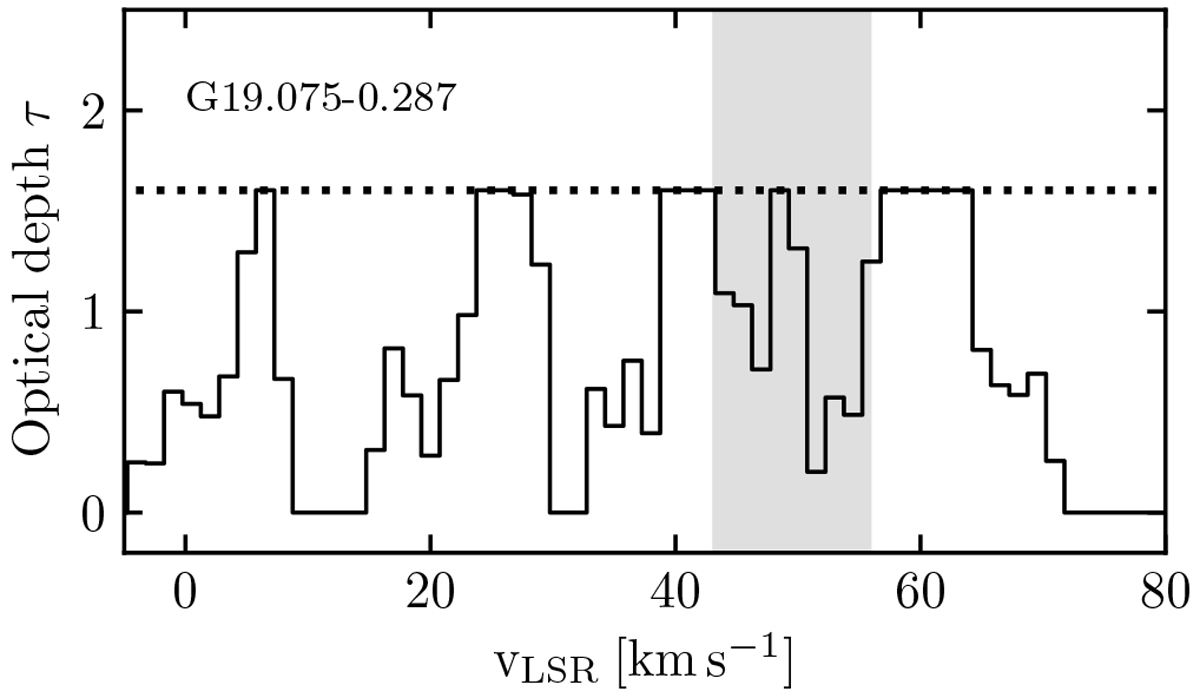
Optical depth measurement toward the H II region G19.075-0.287 (Wang et al. 2018). The plot shows the optical depth as a function of LSR velocity and was computed using Eq. (9). For some channels, the absorption spectrum saturates and the measured optical depth is a lower limit of τ = 1.6, which is indicated by the horizontal dotted line. The gray shaded area indicates the velocity range between 43 and 56 km s −1, where HISA features have been extracted.
Current usage metrics show cumulative count of Article Views (full-text article views including HTML views, PDF and ePub downloads, according to the available data) and Abstracts Views on Vision4Press platform.
Data correspond to usage on the plateform after 2015. The current usage metrics is available 48-96 hours after online publication and is updated daily on week days.
Initial download of the metrics may take a while.