Fig. 11
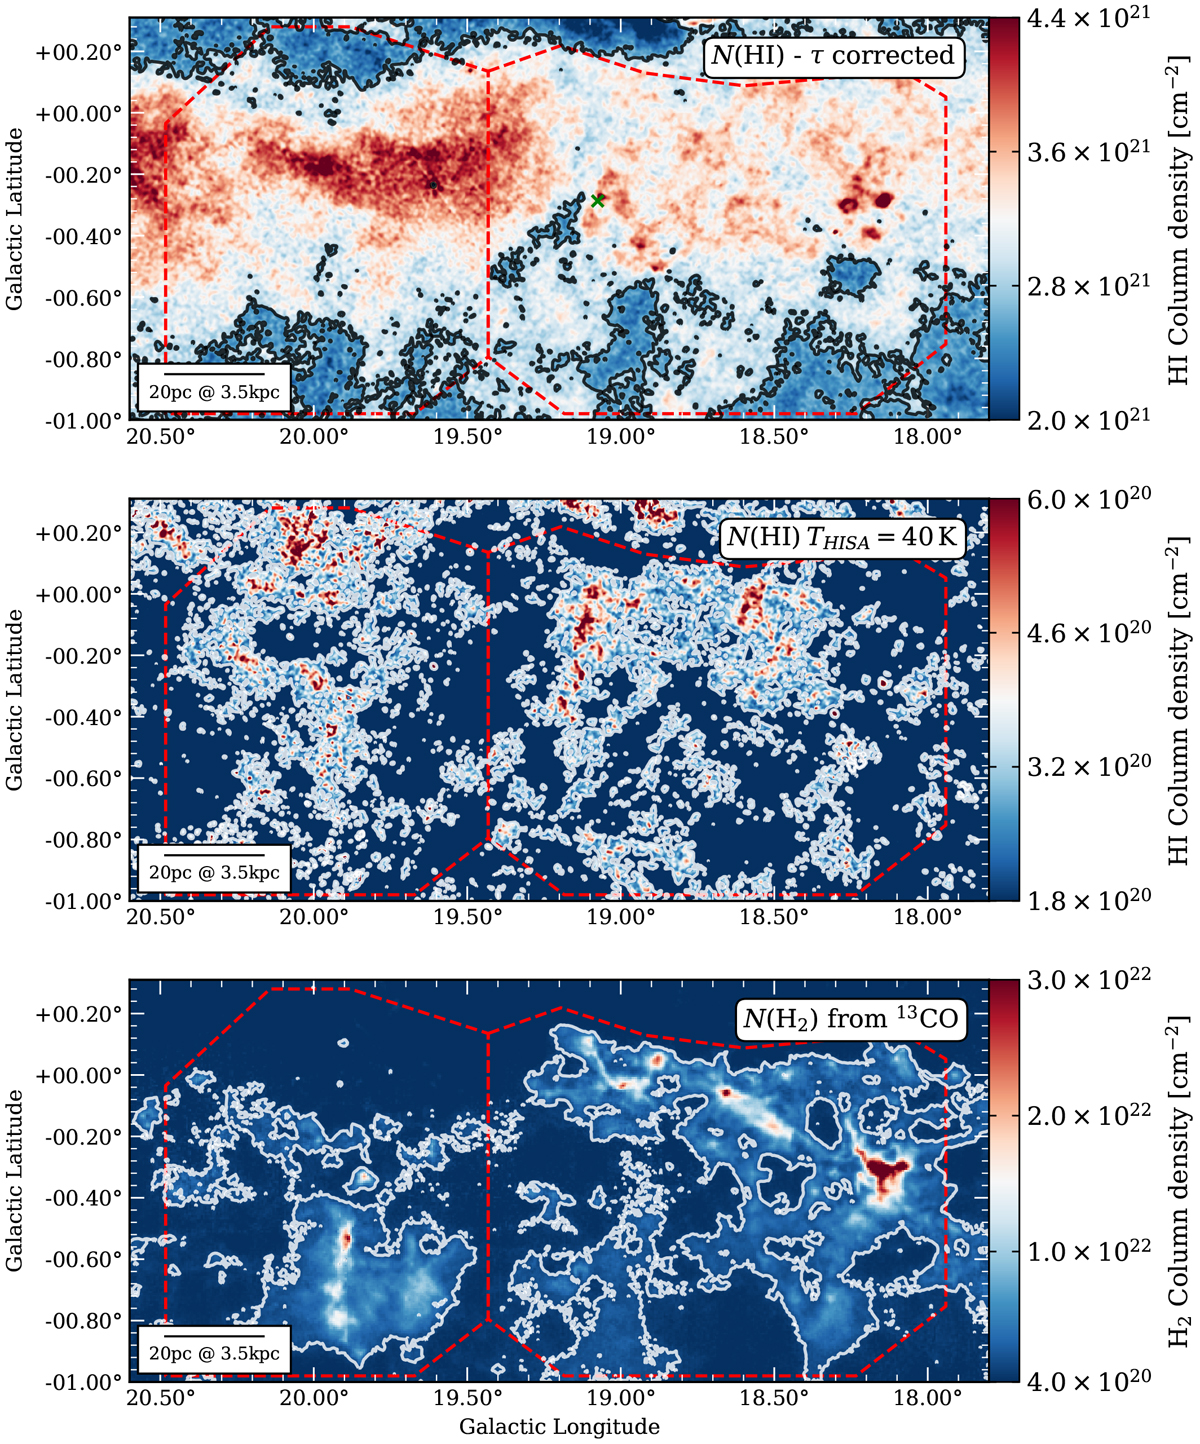
Top panel: H I column densities of the combined WNM and CNM seen in H I emission. The column densities were corrected for optical depth, weak diffuse continuum emission, and the kinematic distance ambiguity. The optical depth is measured toward the continuum source G19.075-0.287 and is applied to correct the column densities throughout the whole cloud (see Sect. 3.3.3). The position of G19.075-0.287 is indicated by the green cross. Middle panel: H I column densities of the CNM inferred from HISA features assuming a spin temperature of THISA = 40 K and a background fraction of p = 0.9. Bottom panel: H2 column densities inferred from 13CO as a tracer. We assumed an H2∕13CO ratio of 3.4 × 10⁵. The red dashed polygons in each panel indicate the eastern and western part of the filament that are analyzed separately. The white and black contours indicate the column density thresholds that were used for the derivation of the column density probability density functions (see Sect. 4.2).
Current usage metrics show cumulative count of Article Views (full-text article views including HTML views, PDF and ePub downloads, according to the available data) and Abstracts Views on Vision4Press platform.
Data correspond to usage on the plateform after 2015. The current usage metrics is available 48-96 hours after online publication and is updated daily on week days.
Initial download of the metrics may take a while.