Fig. 1
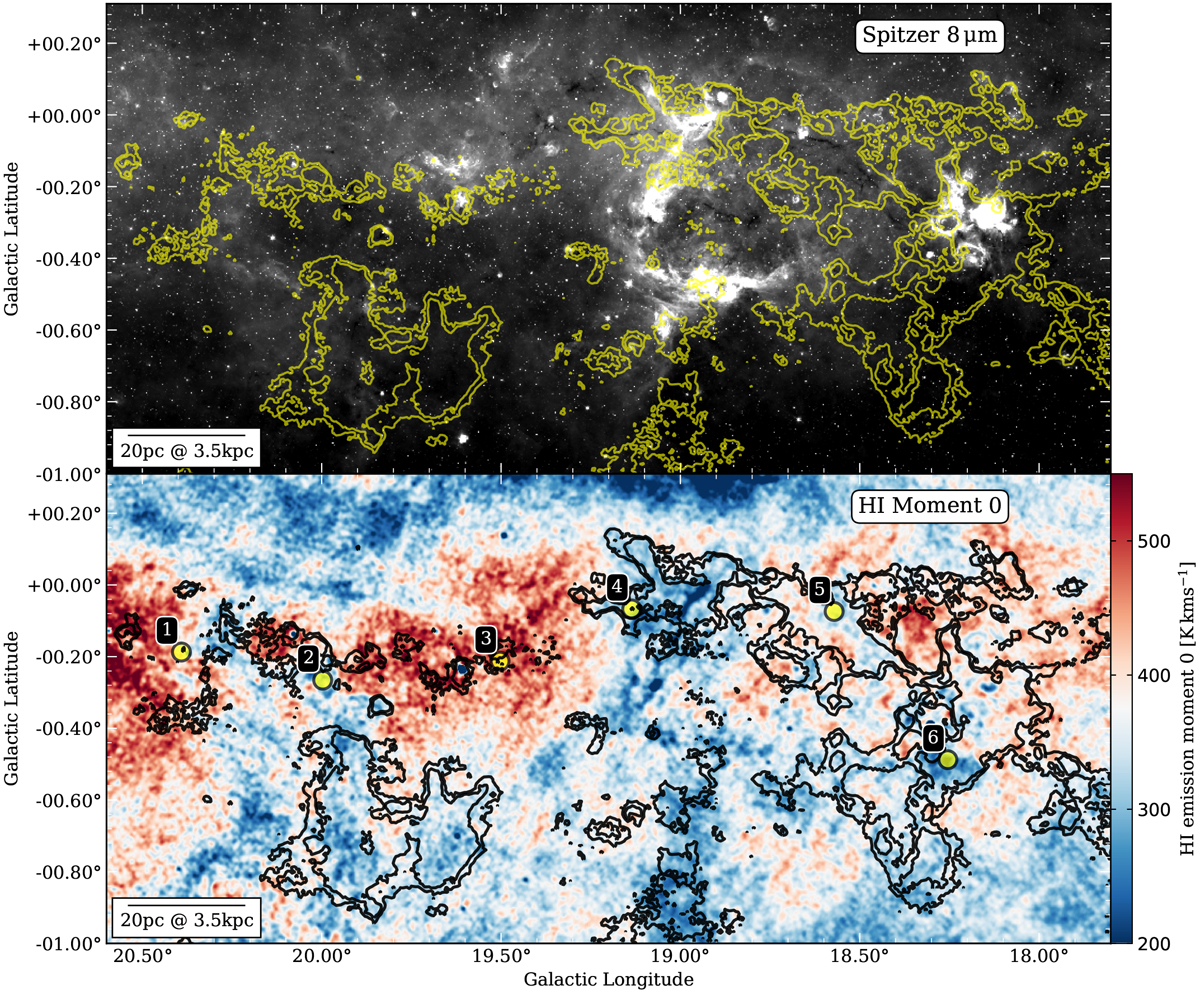
GMF20.0-17.9 overview. Top panel: Spitzer GLIMPSE 8 μm image of GMF20.0-17.9 (Churchwell et al. 2009). The color scale is chosen to bring IRDC features to prominence. Bottom panel: H I integrated emission for a small velocity interval from 44.5–47.5 km s−1. The yellow and black contours show the integrated 13CO emission from 42 to 57 km s−1 at the levels of 10.5 and 15 K km s−1, respectively.The yellow circles in the bottom panel mark the regions of the spectra shown in Fig. 4.
Current usage metrics show cumulative count of Article Views (full-text article views including HTML views, PDF and ePub downloads, according to the available data) and Abstracts Views on Vision4Press platform.
Data correspond to usage on the plateform after 2015. The current usage metrics is available 48-96 hours after online publication and is updated daily on week days.
Initial download of the metrics may take a while.