Fig. 2.
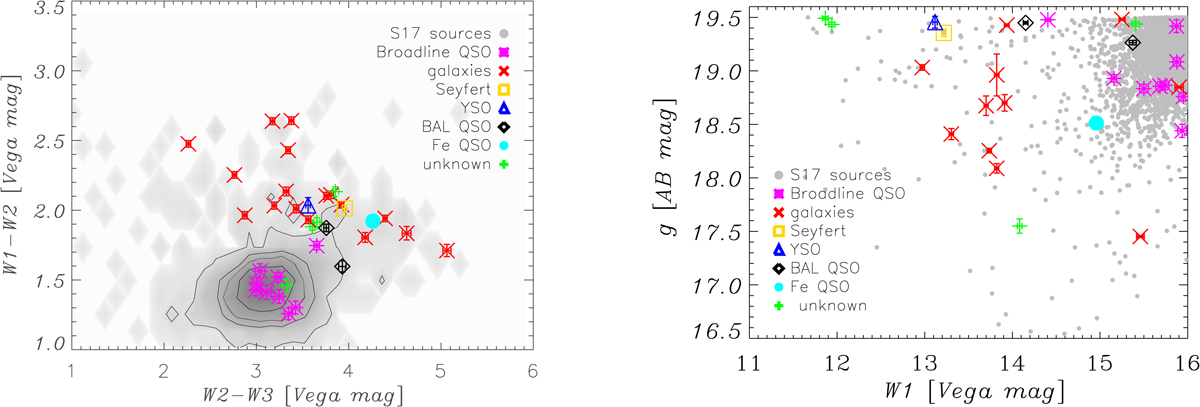
Left panel: colour-colour diagram with the classes of observed anomalies marked as different symbols: broadline QSOs are shown as asterisks, BAL QSOs as diamonds, a YSO as a triangle, galaxies as crosses, a Seyfert galaxy as a square, and unidentified objects as plus signs. Right panel: W1 magnitude in Vega plotted against gAB magnitude for the targeted sources (same colour and symbol coded as for left panel). Grey contours and points mark the position of all OCSVM anomalies contained in the S17 catalogue which have optical detection with gAB < 19.5.
Current usage metrics show cumulative count of Article Views (full-text article views including HTML views, PDF and ePub downloads, according to the available data) and Abstracts Views on Vision4Press platform.
Data correspond to usage on the plateform after 2015. The current usage metrics is available 48-96 hours after online publication and is updated daily on week days.
Initial download of the metrics may take a while.