Free Access
Fig. B.1.
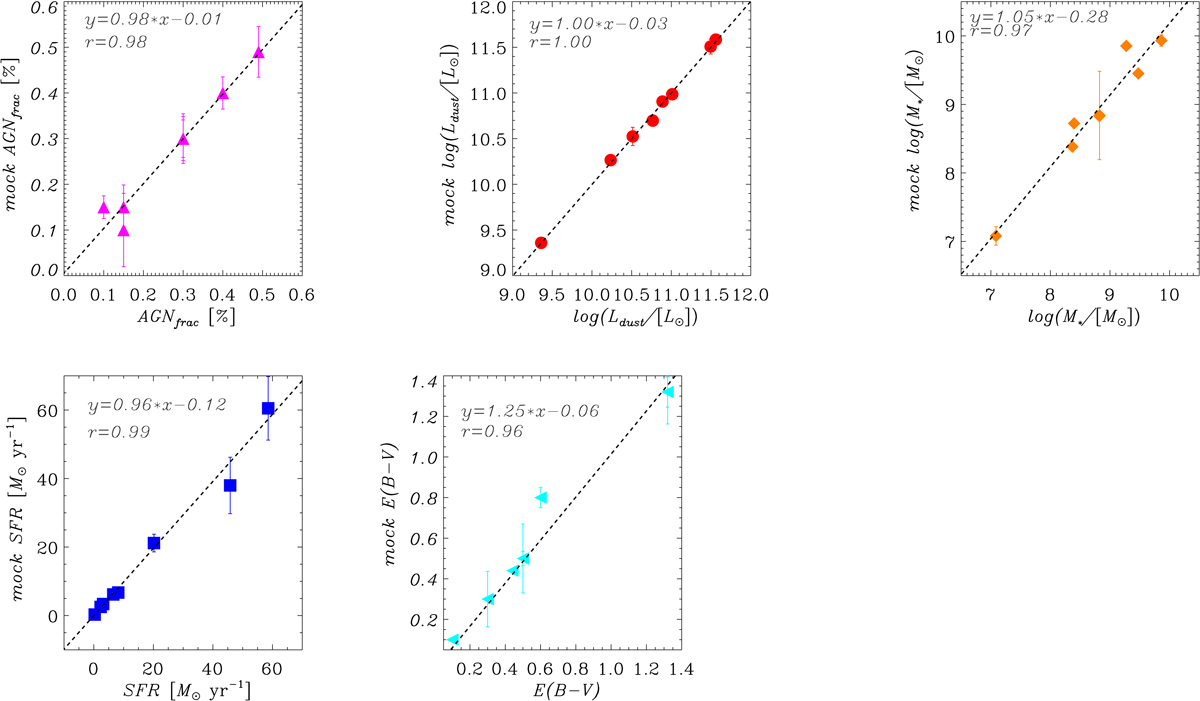
Mock catalogue SED fitting results for each parameter evaluated in this work. The x-axis shows the model values, while the y-axis shows the SED fitting of the mock data. Standard error given by the Bayesian analysis is over-plotted as an error bar for each value.
Current usage metrics show cumulative count of Article Views (full-text article views including HTML views, PDF and ePub downloads, according to the available data) and Abstracts Views on Vision4Press platform.
Data correspond to usage on the plateform after 2015. The current usage metrics is available 48-96 hours after online publication and is updated daily on week days.
Initial download of the metrics may take a while.