Free Access
Fig. 9.
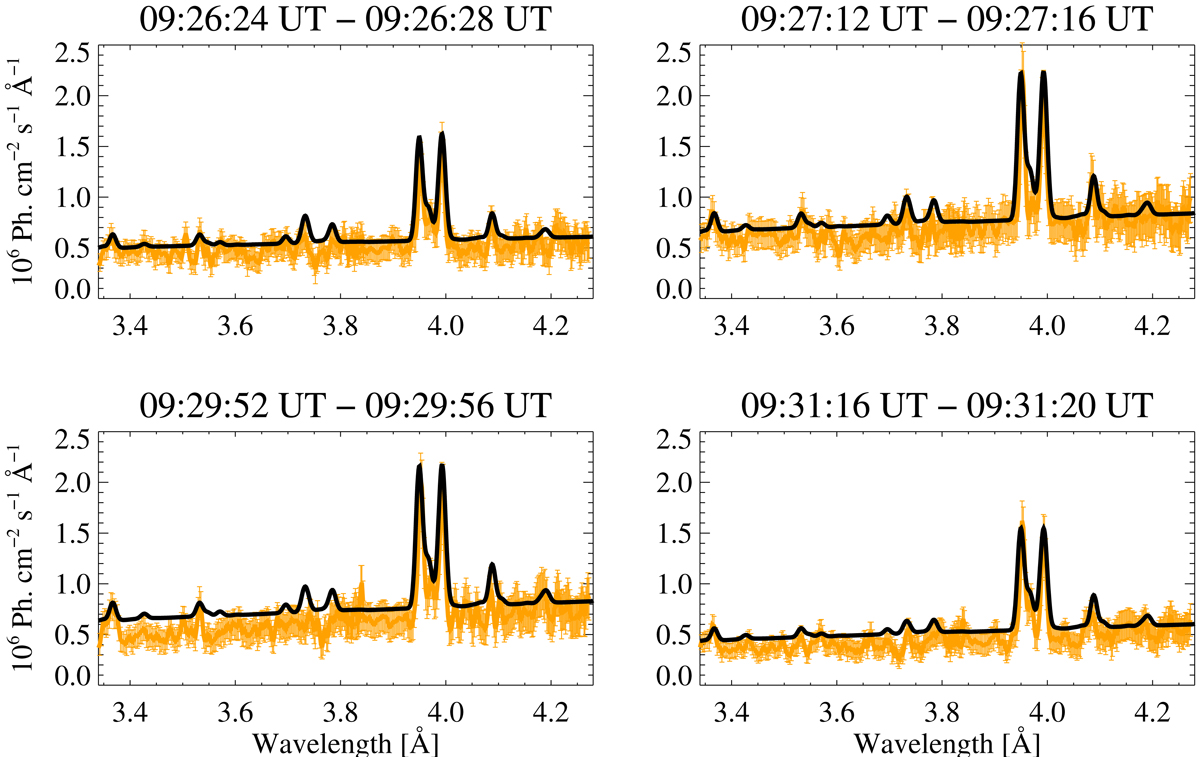
Comparison of RESIK observations for 20 September 2002 flare (in orange) and synthetic spectra (in black) calculated based on the results of 1D-HD modelling and multiplied by the correlation coefficients for four selected observations taken in the different phases of the flare’s evolution.
Current usage metrics show cumulative count of Article Views (full-text article views including HTML views, PDF and ePub downloads, according to the available data) and Abstracts Views on Vision4Press platform.
Data correspond to usage on the plateform after 2015. The current usage metrics is available 48-96 hours after online publication and is updated daily on week days.
Initial download of the metrics may take a while.