Fig. 7.
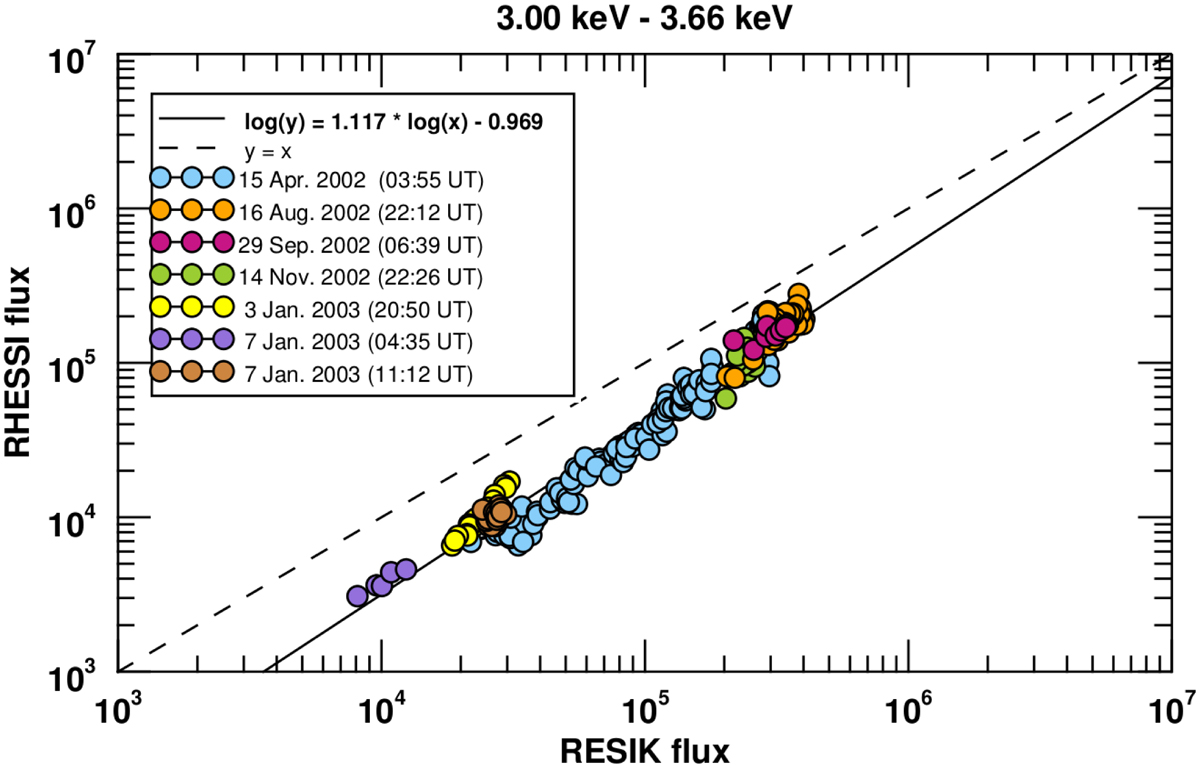
Correlation of RESIK and RHESSI fluxes for energy range 3.00–3.66 keV. Different colours represent observations from different flares (see Table 2). The analysis of RHESSI data was made applying grids 1F, 3F, 4F, 6F, 8F, and 9F. The continuous black line represents the linear regression, the coefficients of which are calculated by the least squares method. The dashed black line represent equal fluxes.
Current usage metrics show cumulative count of Article Views (full-text article views including HTML views, PDF and ePub downloads, according to the available data) and Abstracts Views on Vision4Press platform.
Data correspond to usage on the plateform after 2015. The current usage metrics is available 48-96 hours after online publication and is updated daily on week days.
Initial download of the metrics may take a while.