Fig. 6.
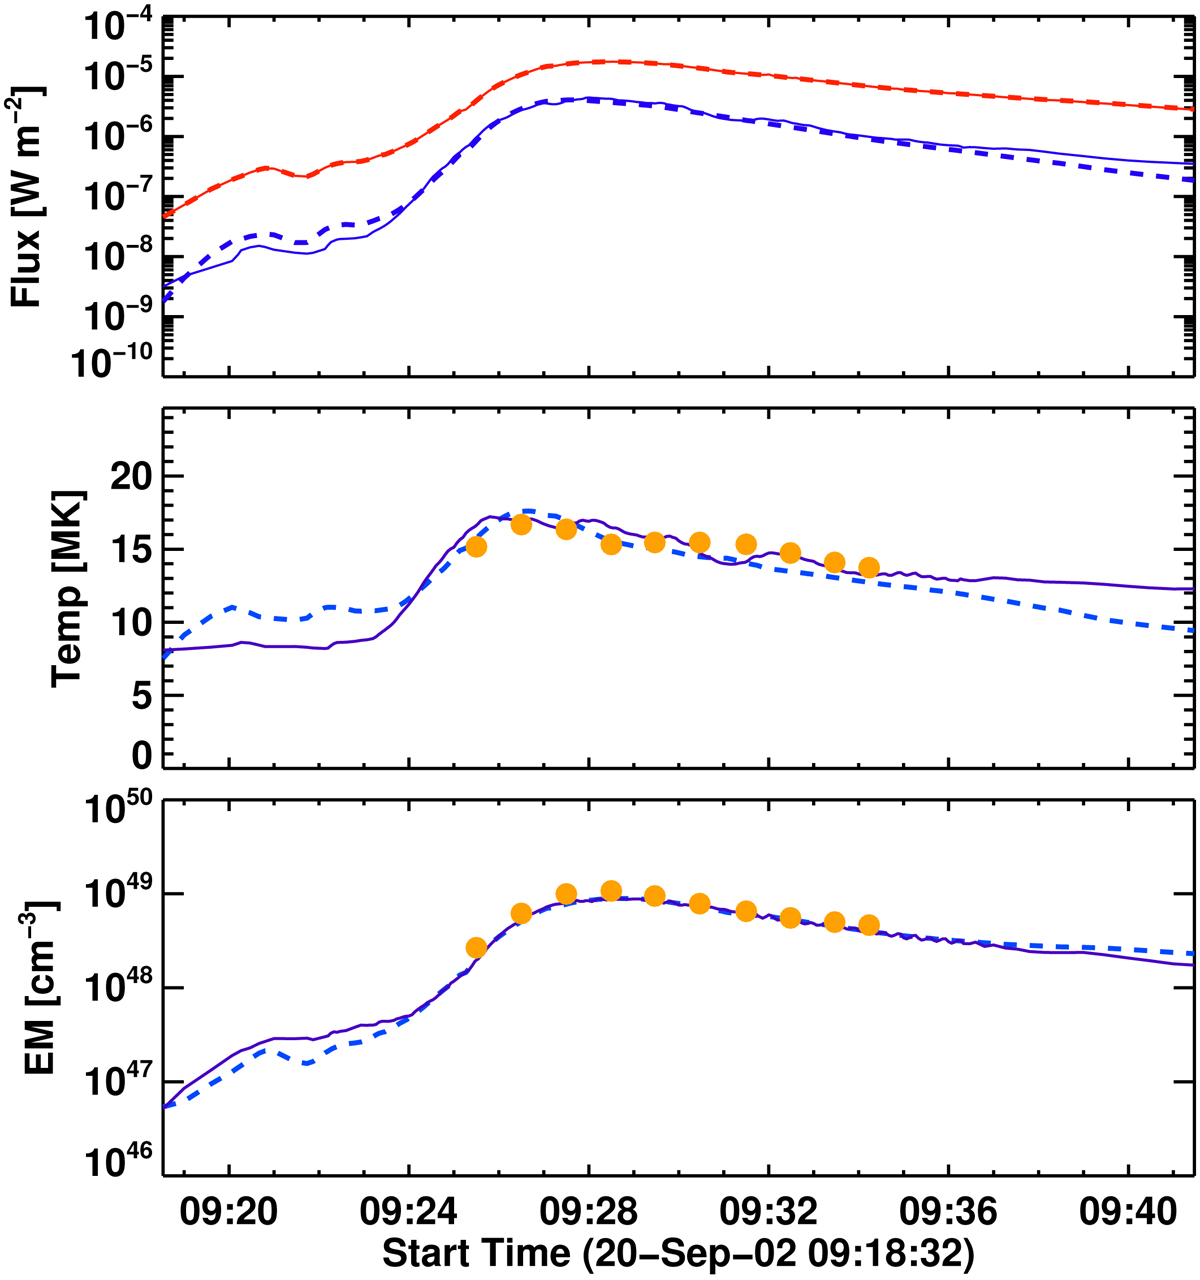
GOES light curves (top), temporal evolution of temperature (middle panel), and emission measure (bottom) calculated based on GOES fluxes. The values related with observations from GOES are plotted as dashed lines, and solid lines represent the values as obtained based on GOES fluxes synthesised using the numerical 1D-HD model. Red and blue colours in the top panel correspond to the GOES 0.5–4 Å and 1–8 Å channels. The orange dots represent the average temperature (Ta, middle panel) and total emission measure (EMtot, bottom) values calculated based on the DEM distributions from RESIK data.
Current usage metrics show cumulative count of Article Views (full-text article views including HTML views, PDF and ePub downloads, according to the available data) and Abstracts Views on Vision4Press platform.
Data correspond to usage on the plateform after 2015. The current usage metrics is available 48-96 hours after online publication and is updated daily on week days.
Initial download of the metrics may take a while.