Fig. 5.
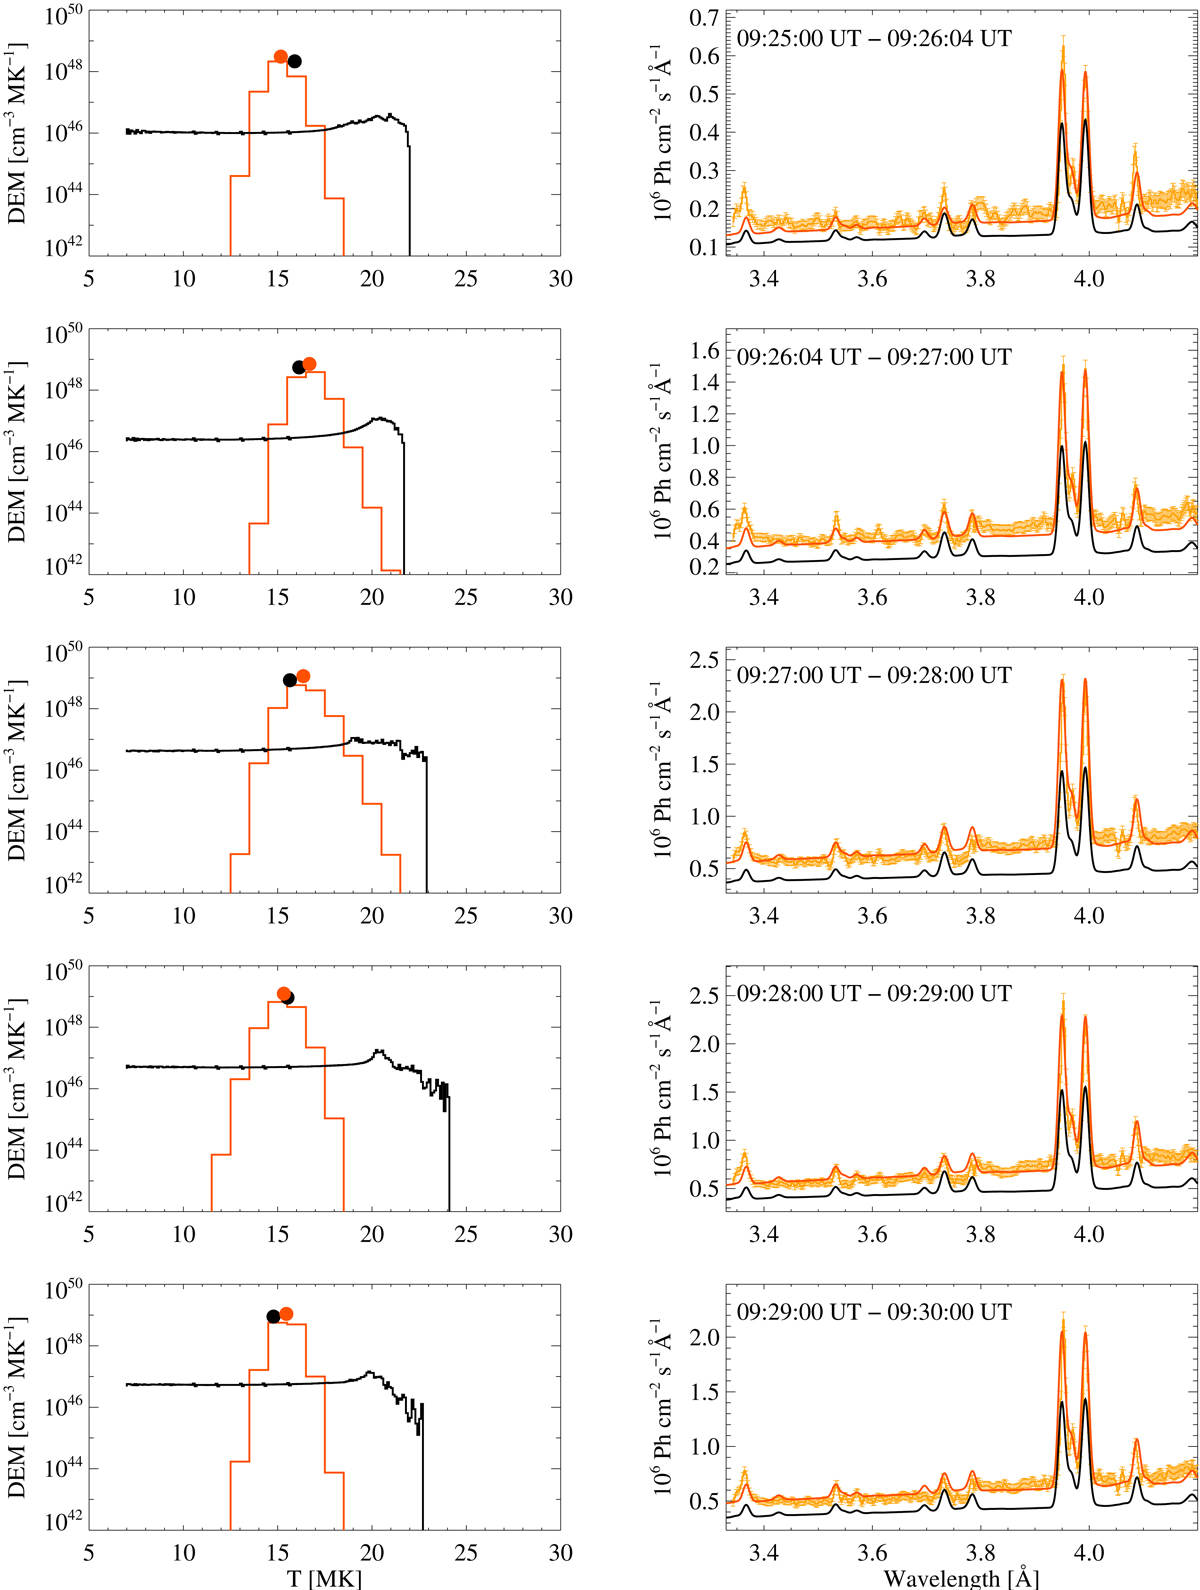
Sequence of DEM distributions (left panels) and observed and calculated spectra (right) taken at five selected time intervals. Black and orange colours are related to the 1D-HD model and RESIK DEMs, respectively. The dots correspond to the values of average temperature and total emission measure (see the text) calculated from the DEM distributions. Right panels: RESIK measured spectra with uncertainties are shown in light orange. The synthetic spectra calculated based on DEM distributions (from left panel) are plotted in black and dark orange lines.
Current usage metrics show cumulative count of Article Views (full-text article views including HTML views, PDF and ePub downloads, according to the available data) and Abstracts Views on Vision4Press platform.
Data correspond to usage on the plateform after 2015. The current usage metrics is available 48-96 hours after online publication and is updated daily on week days.
Initial download of the metrics may take a while.