Free Access
Fig. 4.
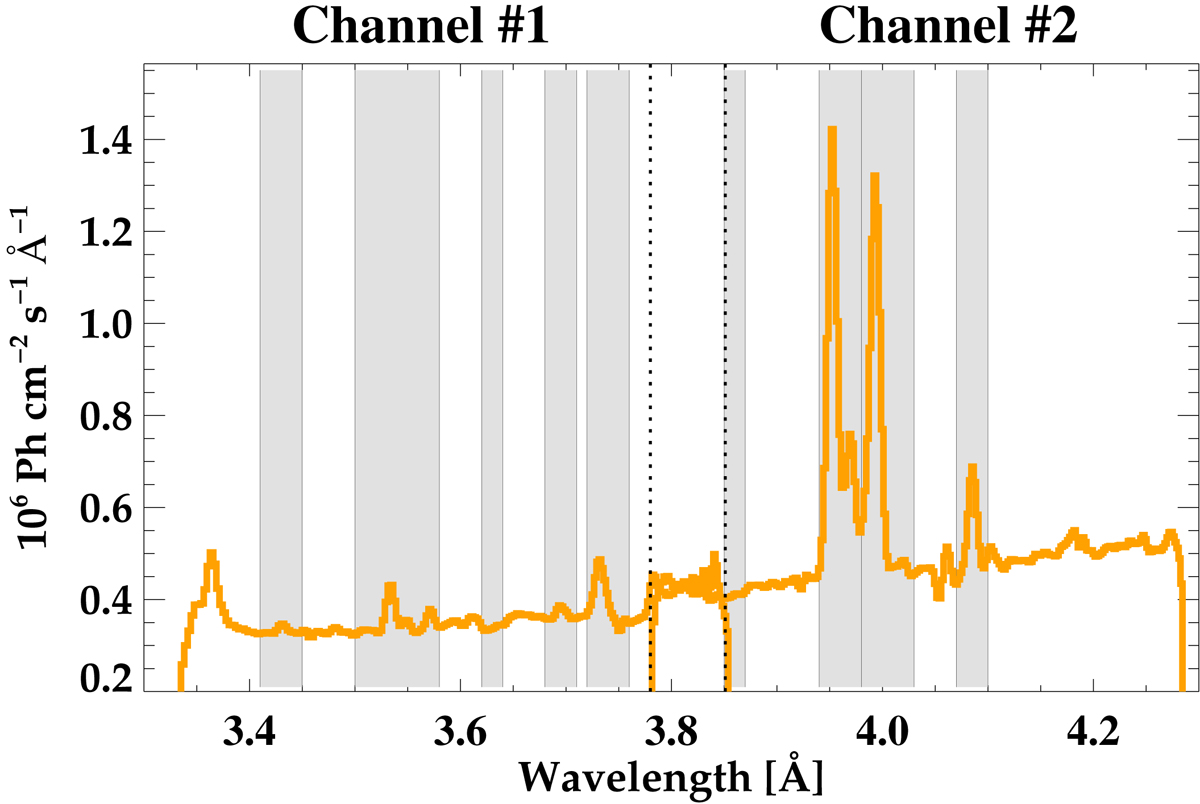
Average spectrum observed by RESIK for the 20 September 2002 flare with selected spectral bands used for DEM analysis. The spectral range where the no. 1 and no. 2 RESIK channels overlap is marked by two vertical dotted lines.
Current usage metrics show cumulative count of Article Views (full-text article views including HTML views, PDF and ePub downloads, according to the available data) and Abstracts Views on Vision4Press platform.
Data correspond to usage on the plateform after 2015. The current usage metrics is available 48-96 hours after online publication and is updated daily on week days.
Initial download of the metrics may take a while.