Fig. 3.
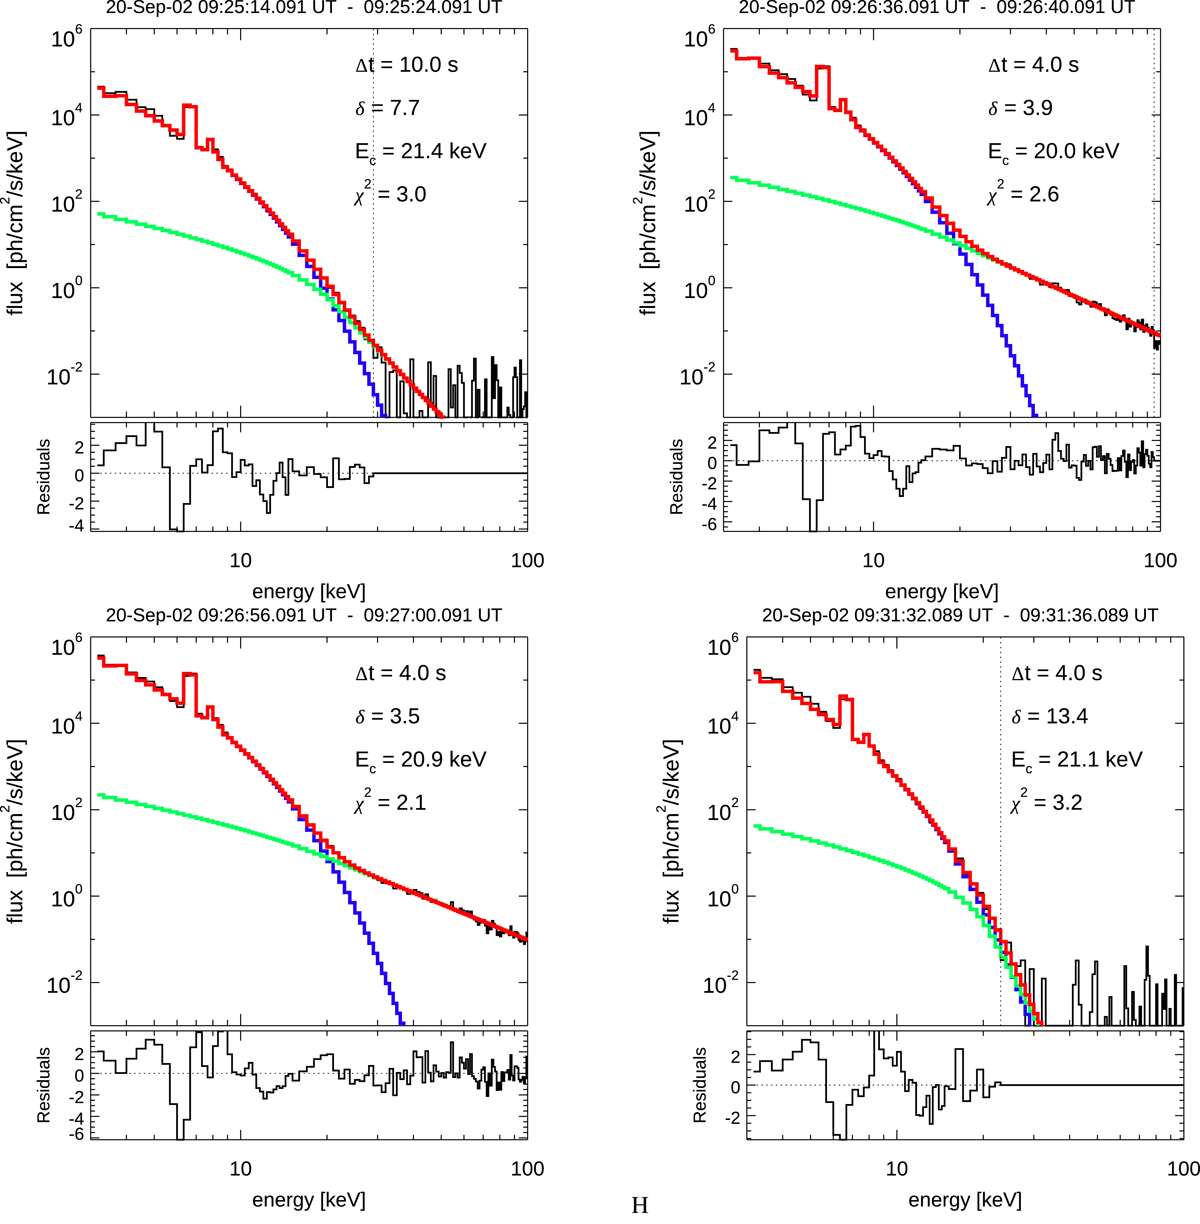
RHESSI spectra taken in four time periods of the flare on 20 September 2002. The spectra were fitted with an isothermal model (blue colour) and thick-target model (green). The combined spectra are shown in red. The accumulation time (Δt), power law index of the electron energy distribution (δ), low-energy cutoff of the electron distribution (Ec), and χ2 values are indicated in the top right-hand corner of each panel. The vertical dashed lines correspond to the energy values (upper limits) to which the spectra have been fitted and are 29 keV, 95 keV, 165 keV and 23 keV for the spectra shown in the figure. The lower limit is 3 keV for each analysed spectrum.
Current usage metrics show cumulative count of Article Views (full-text article views including HTML views, PDF and ePub downloads, according to the available data) and Abstracts Views on Vision4Press platform.
Data correspond to usage on the plateform after 2015. The current usage metrics is available 48-96 hours after online publication and is updated daily on week days.
Initial download of the metrics may take a while.