Fig. 2.
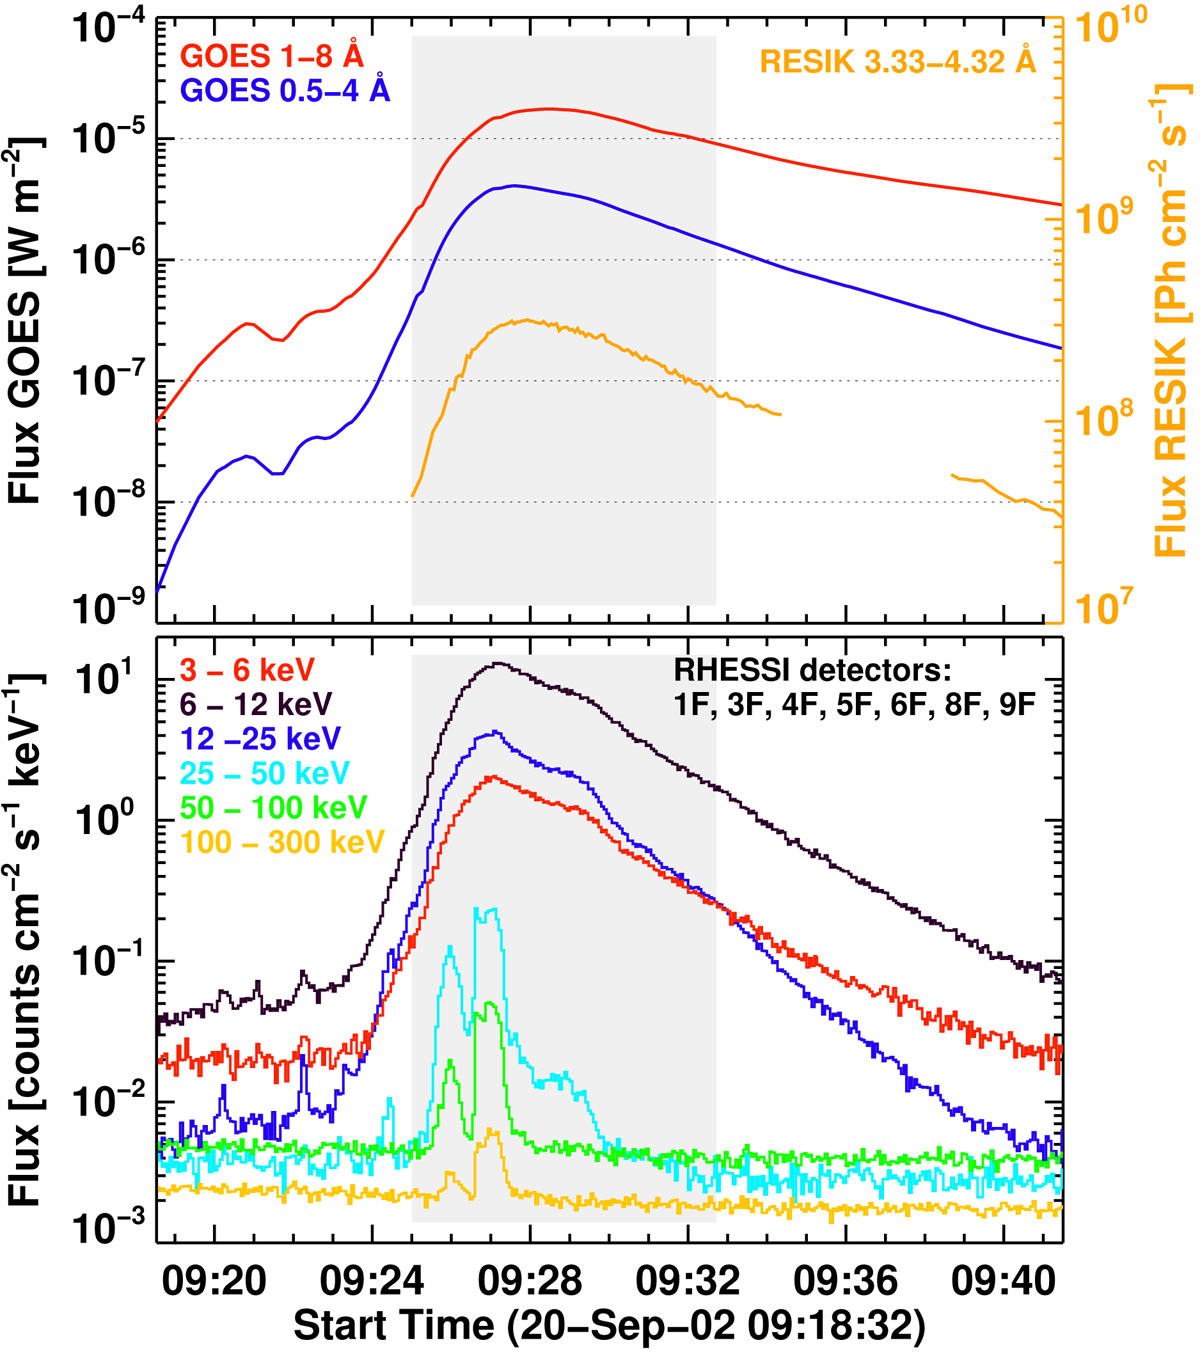
Upper panel: GOES 0.5–4 Å and 1–8 Å light curves and temporal evolution of RESIK flux in the 3.33 Å–4.32 Å wavelength range. The GOES fluxes should be referred to the left-hand y-axis, the RESIK fluxes to the right-hand y-axis. Lower panel: RHESSI light curves of five energy bands between 4 and 300 keV taken during the 20 September 2002 flare. The grey box indicates the time interval from which the observations were used for the analysis.
Current usage metrics show cumulative count of Article Views (full-text article views including HTML views, PDF and ePub downloads, according to the available data) and Abstracts Views on Vision4Press platform.
Data correspond to usage on the plateform after 2015. The current usage metrics is available 48-96 hours after online publication and is updated daily on week days.
Initial download of the metrics may take a while.