Fig. 1.
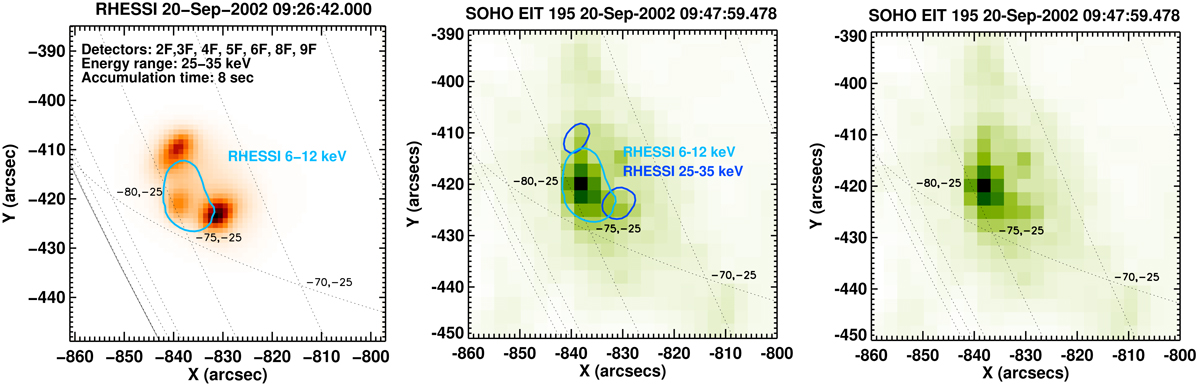
RHESSI and EIT images of the M1.8 GOES class solar flare on 20 September 2002. Left panel: RHESSI image restored using the PIXON method in 6–12 keV (isophote) and 25–35 keV (red scale) energy bands. The signal was accumulated between 09:26:42 UT and 09:26:50 UT (Falewicz et al. 2015). Middle: SOHO/EIT 195 Å image taken at 09:47:59 UT (green scale) overplotted with the RHESSI 6 keV–12 keV and 25–35 keV images registered at 09:26:42 UT (dark and light blue contours). The isophotes shown correspond to 30% of the peak intensity. Right panel: SOHO/EIT image shown without RHESSI contours.
Current usage metrics show cumulative count of Article Views (full-text article views including HTML views, PDF and ePub downloads, according to the available data) and Abstracts Views on Vision4Press platform.
Data correspond to usage on the plateform after 2015. The current usage metrics is available 48-96 hours after online publication and is updated daily on week days.
Initial download of the metrics may take a while.