Fig. 8.
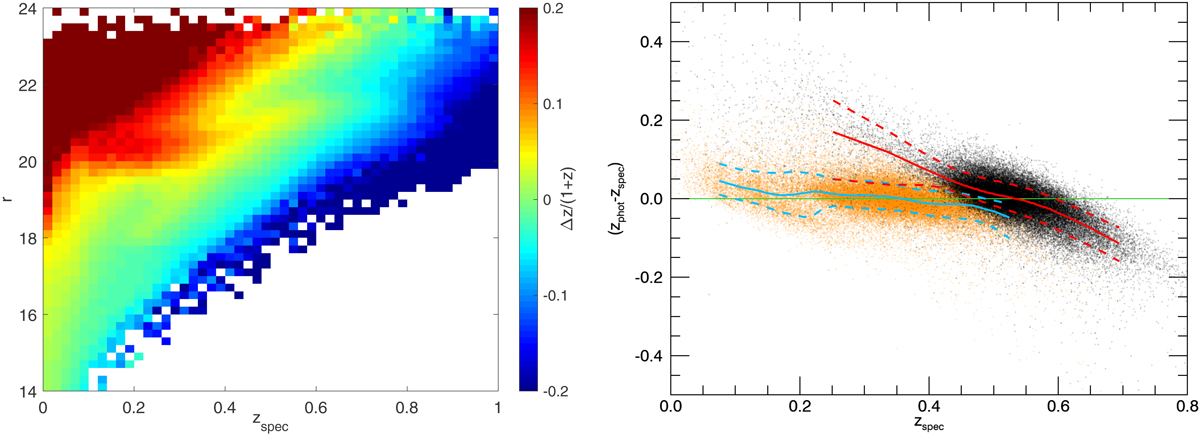
Left panel: average normalised error Δznorm = (zphot − zspec)/(1 + zspec) as a function of the magnitude r and the spectroscopic redshift zspec. Right panel: redshift error zphot − zspec as a function of the spectroscopic redshift zspec for galaxies with 18 < r < 20 (orange dots) and 20 < r < 21 (black dots). Each dot represents an individual galaxy (only 10% of the galaxies are shown, for better visualisation). The thick solid and dotted lines represent the median and the 68% confidence regions, respectively, computed in small zspec intervals for the galaxies with 18 < r < 20 (blue lines) and 20 < r < 21 (red lines). The green line shows zphot = zspec. The results in both panels were obtained with a 100-fold cross-validation strategy on 𝒯5.
Current usage metrics show cumulative count of Article Views (full-text article views including HTML views, PDF and ePub downloads, according to the available data) and Abstracts Views on Vision4Press platform.
Data correspond to usage on the plateform after 2015. The current usage metrics is available 48-96 hours after online publication and is updated daily on week days.
Initial download of the metrics may take a while.