Fig. 6.
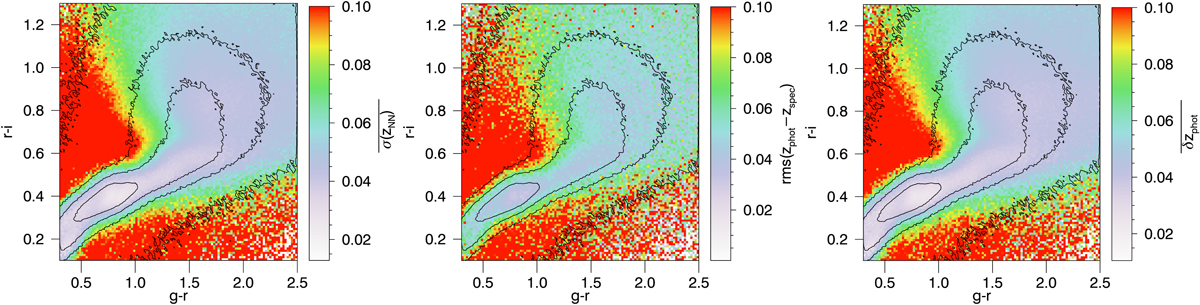
Photometric redshift results as a function of the r − i and g − r colours. These results were obtained with a 100-fold cross-validation strategy on the set of galaxies with the five magnitudes available (𝒯5). Left panel: average standard deviation of the redshifts of the nearest neighbours σ(zNN), middle panel: rms of the actual error zphot − zspec, and right panel: average estimated errors δzphot. For easier comparison, the scale in the three panels was set between 0 and 0.1, with red indicating errors that are bigger than or equal to 0.1. For reference, the black lines represent the contours of the galaxy count distribution of the training set 𝒯5, with the four displayed contours corresponding to 1000, 300, 100, and 10 galaxies per colour bin.
Current usage metrics show cumulative count of Article Views (full-text article views including HTML views, PDF and ePub downloads, according to the available data) and Abstracts Views on Vision4Press platform.
Data correspond to usage on the plateform after 2015. The current usage metrics is available 48-96 hours after online publication and is updated daily on week days.
Initial download of the metrics may take a while.