Fig. 4.
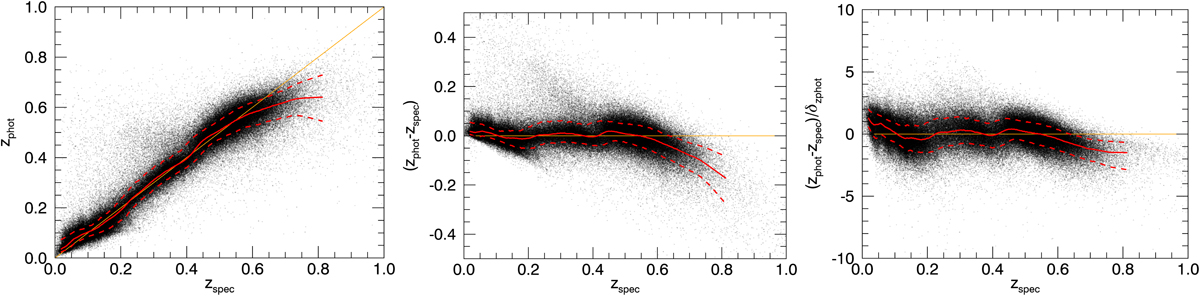
Photometric redshift zphot (left), redshift error zphot − zspec (middle), and error divided by the estimation of the error provided by the method (zphot − zspec)/δzphot (right) as a function of the spectroscopic redshift zspec. These results were obtained with a 100-fold cross-validation strategy on the set of galaxies with the five magnitudes available (𝒯5). The black dots represent the individual galaxies. Only 10% of the galaxies are shown, for better visualisation. The red solid and dotted lines represent the median and the 68% confidence regions, respectively, computed for groups of 10 000 galaxies with consecutive zspec. The orange line shows zphot = zspec.
Current usage metrics show cumulative count of Article Views (full-text article views including HTML views, PDF and ePub downloads, according to the available data) and Abstracts Views on Vision4Press platform.
Data correspond to usage on the plateform after 2015. The current usage metrics is available 48-96 hours after online publication and is updated daily on week days.
Initial download of the metrics may take a while.