Open Access
Fig. 1.
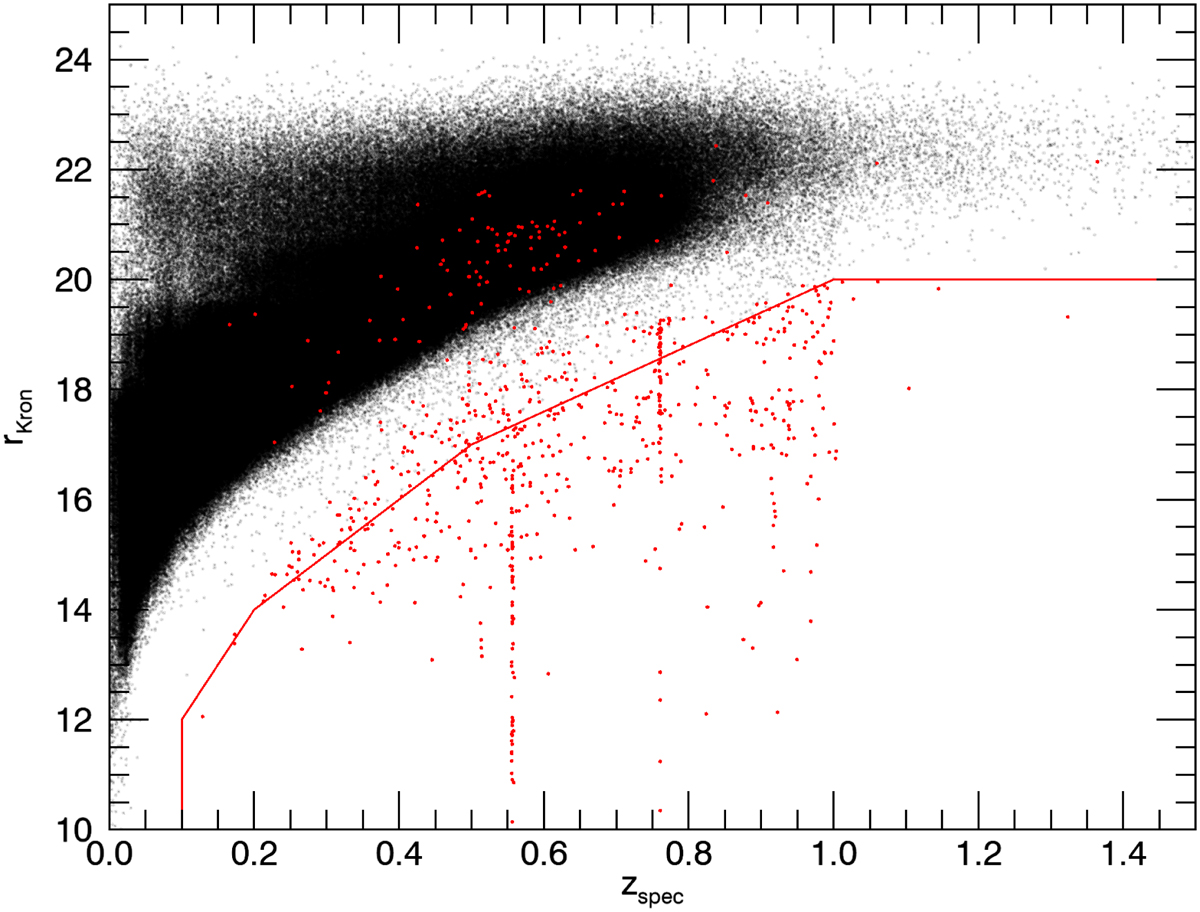
Scatter plot of r Kron magnitude as a function of the spectroscopic redshift for the galaxies in the training set (black dots). Red dots represent the galaxies that are removed for not satisfying the magnitude limits defined in Table 2. The red line represents the magnitude limits for the r-band.
Current usage metrics show cumulative count of Article Views (full-text article views including HTML views, PDF and ePub downloads, according to the available data) and Abstracts Views on Vision4Press platform.
Data correspond to usage on the plateform after 2015. The current usage metrics is available 48-96 hours after online publication and is updated daily on week days.
Initial download of the metrics may take a while.