Fig. 5.
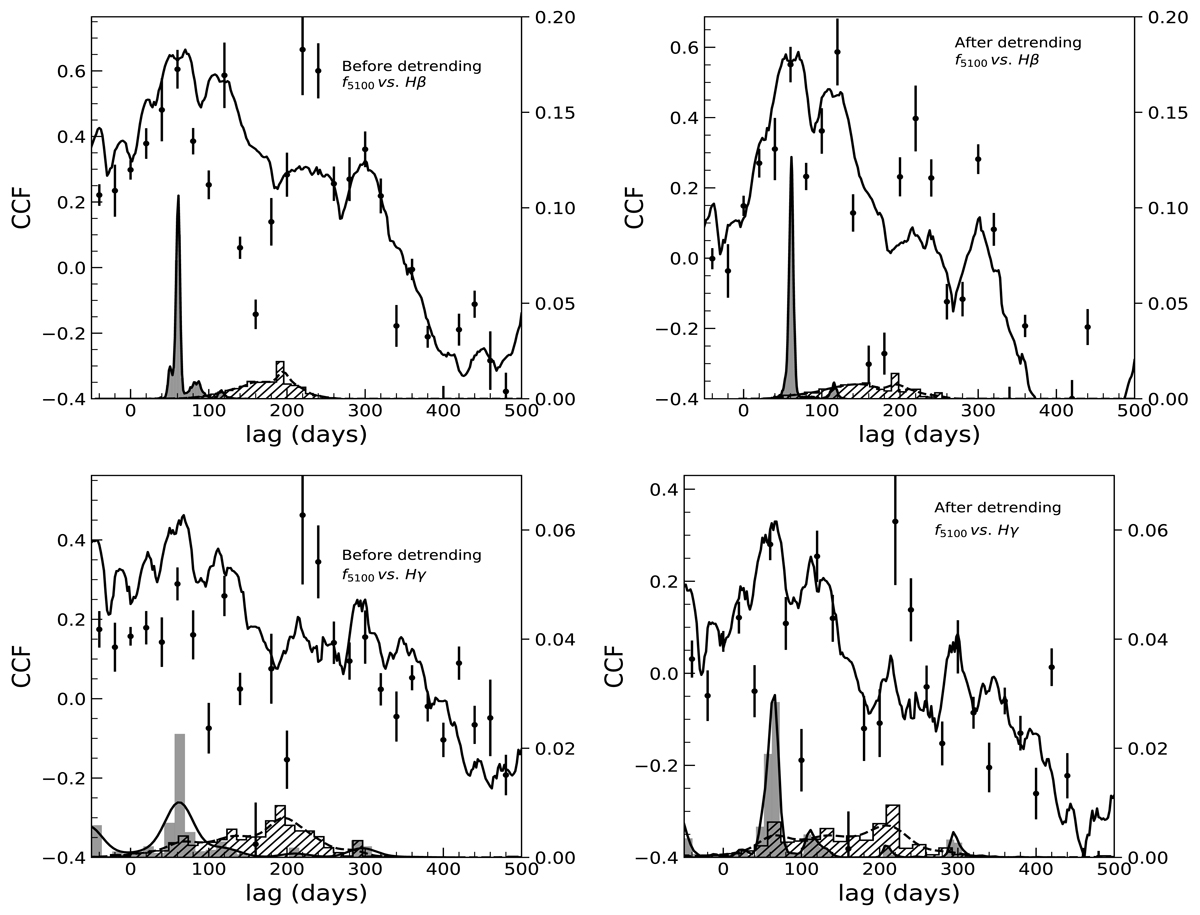
Cross-correlation analysis of f5100 vs. Hβ (top panels) and Hγ (bottom panels) light curves before (left-hand panel) and after detrending (right-hand panel). The ICCF (line) and DCF (points) are shown. The centroid probability distribution from ICCF (filled histogram) and DCF (hatched histogram), along with smooth kernel density (solid and dashed lines, respectively), are also shown.
Current usage metrics show cumulative count of Article Views (full-text article views including HTML views, PDF and ePub downloads, according to the available data) and Abstracts Views on Vision4Press platform.
Data correspond to usage on the plateform after 2015. The current usage metrics is available 48-96 hours after online publication and is updated daily on week days.
Initial download of the metrics may take a while.