Fig. 4.
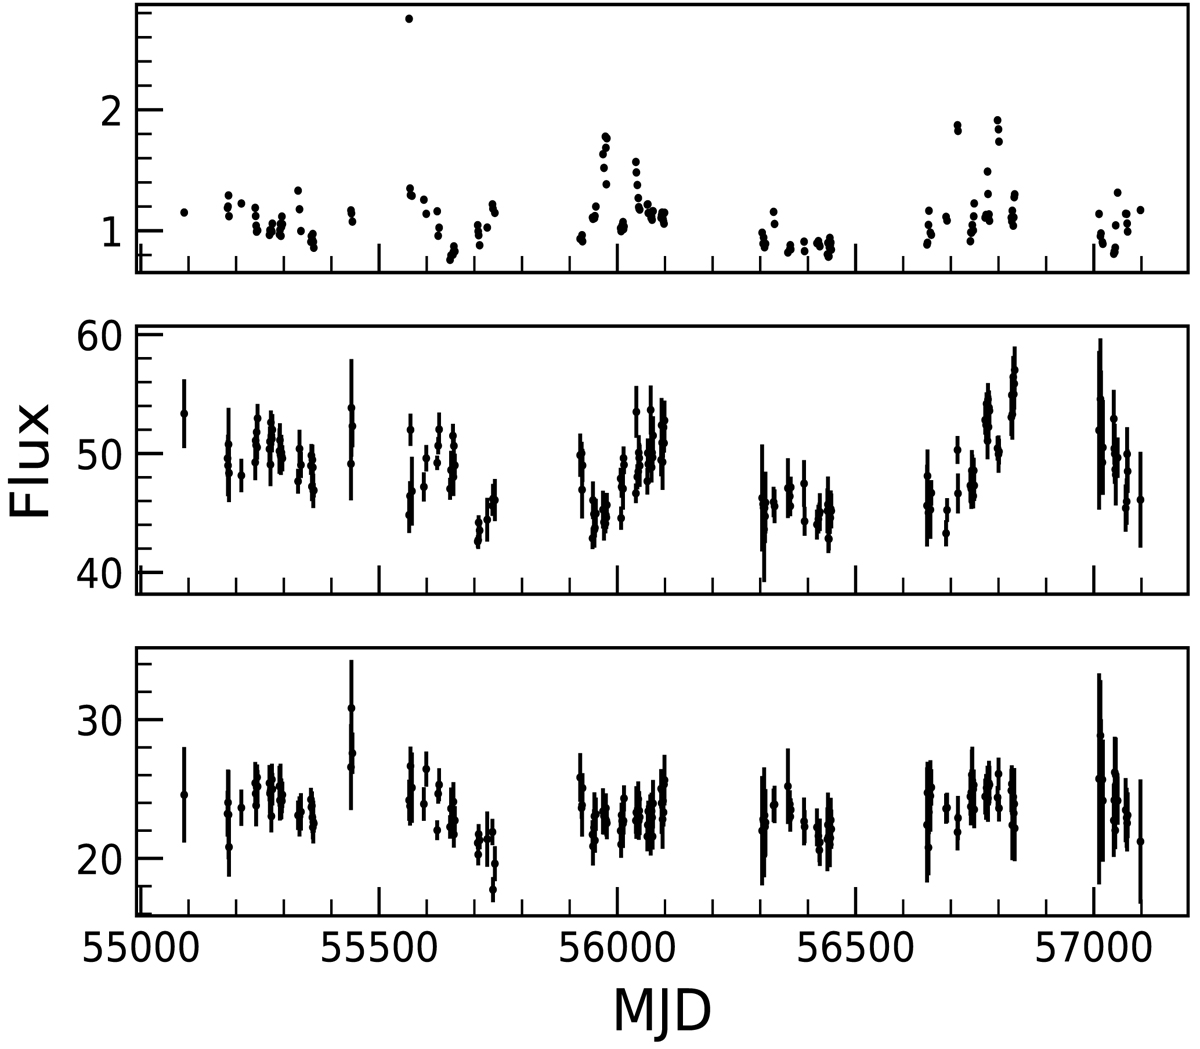
Detrended spectroscopic light curves used in the time delay analysis. From top to bottom: f5100 continuum and Hβ and Hγ line light curves. The units are 10−15 erg s−1 cm−2 Å−1 for f5100 and 10−15 erg s−1 cm−2 for the line light curves. The point above 2 × 10⁻¹⁵ erg s−1 in the f5100 light curve is excluded from the time delay analysis.
Current usage metrics show cumulative count of Article Views (full-text article views including HTML views, PDF and ePub downloads, according to the available data) and Abstracts Views on Vision4Press platform.
Data correspond to usage on the plateform after 2015. The current usage metrics is available 48-96 hours after online publication and is updated daily on week days.
Initial download of the metrics may take a while.