Free Access
Fig. 3.
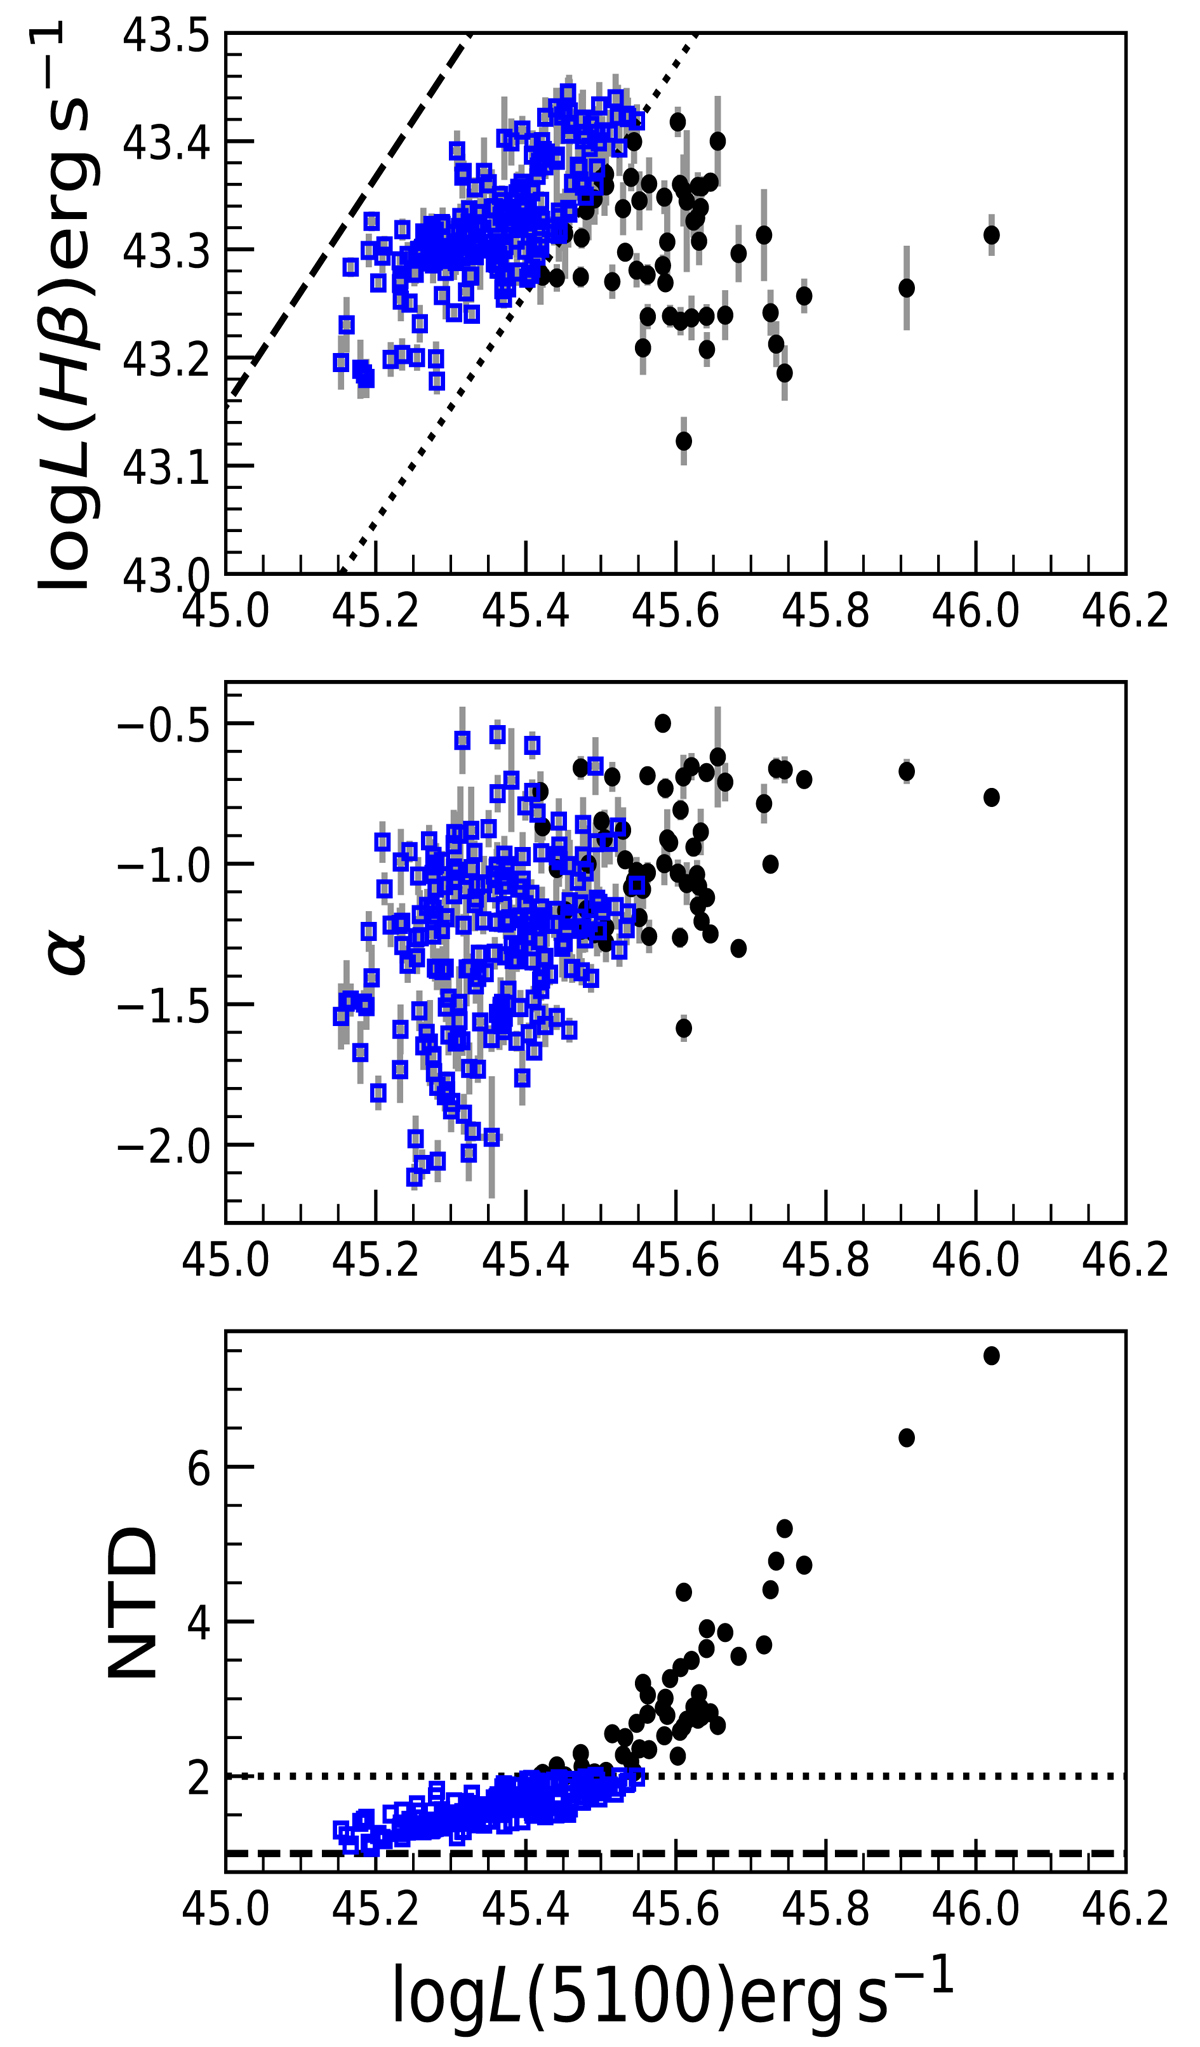
Correlation of Hβ line luminosity (upper panel), optical spectral index (middle panel), and NTD (bottom panel) with L5100 during the monitoring period. The empty squares are the epochs with NTD < 2, while filled circles are those with NTD ≥ 2. The dashed and dotted lines represent NTD = 1 and 2, respectively.
Current usage metrics show cumulative count of Article Views (full-text article views including HTML views, PDF and ePub downloads, according to the available data) and Abstracts Views on Vision4Press platform.
Data correspond to usage on the plateform after 2015. The current usage metrics is available 48-96 hours after online publication and is updated daily on week days.
Initial download of the metrics may take a while.