Fig. 2.
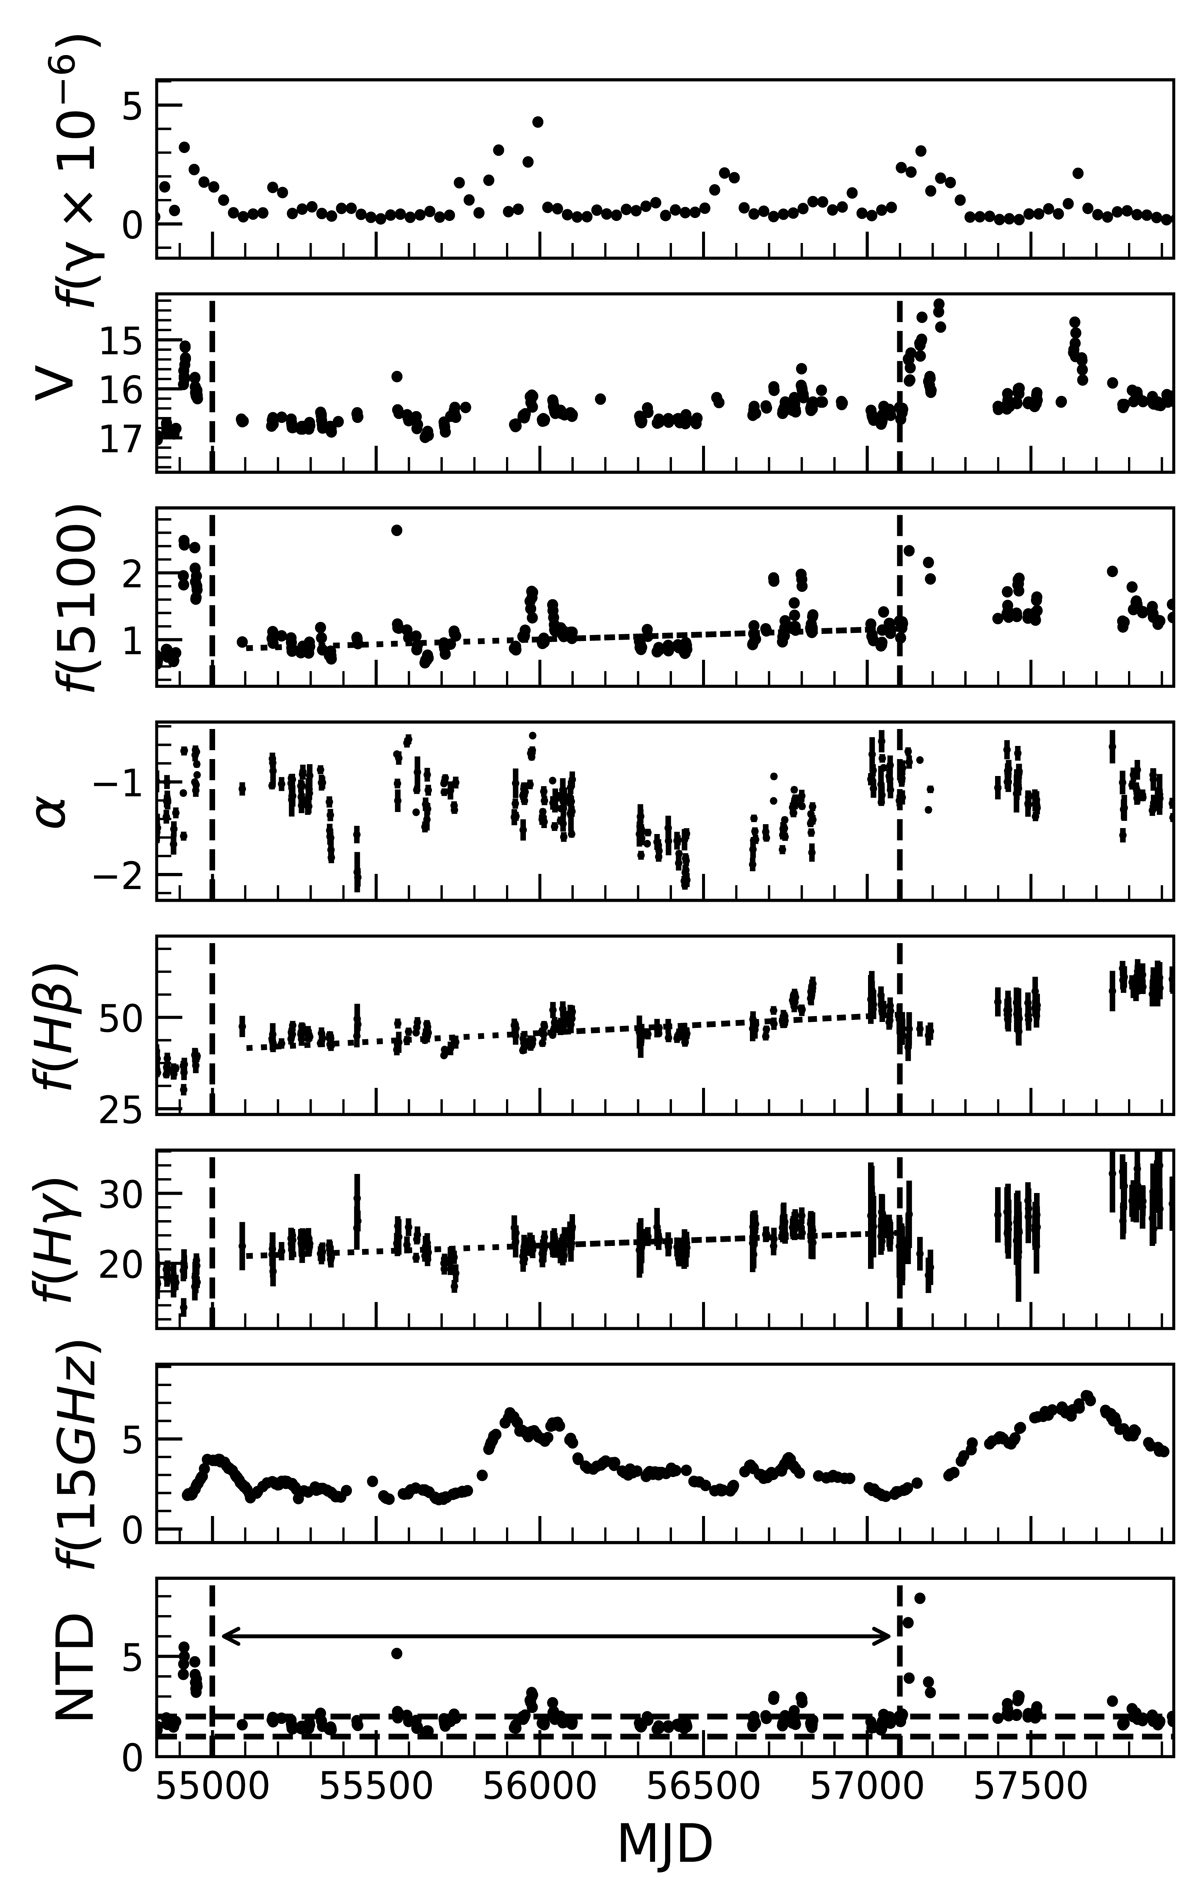
Light curves of PKS 1510-089. From top to bottom: variation of γ ray, V-band, 5100 Å continuum, spectral index, Hβ, Hγ, radio, and non-thermal dominance (NTD; see text) with times. The unit of γ-ray flux is photons s−1 cm−2, f5100 is 10−15 erg s−1 cm−2 Å−1, emission line flux is 10−15 erg s−1 cm−2, and radio flux is Jy. The section between MJD = 55 000−57 100 (window A) of the spectroscopic light curves used in the time series analysis is represented by the vertical lines. The dotted line in the spectroscopic light curve is a linear fit to the data for detrending. Two horizontal lines at NTD = 1 and 2 are shown in the lower panel.
Current usage metrics show cumulative count of Article Views (full-text article views including HTML views, PDF and ePub downloads, according to the available data) and Abstracts Views on Vision4Press platform.
Data correspond to usage on the plateform after 2015. The current usage metrics is available 48-96 hours after online publication and is updated daily on week days.
Initial download of the metrics may take a while.