Fig. A.1.
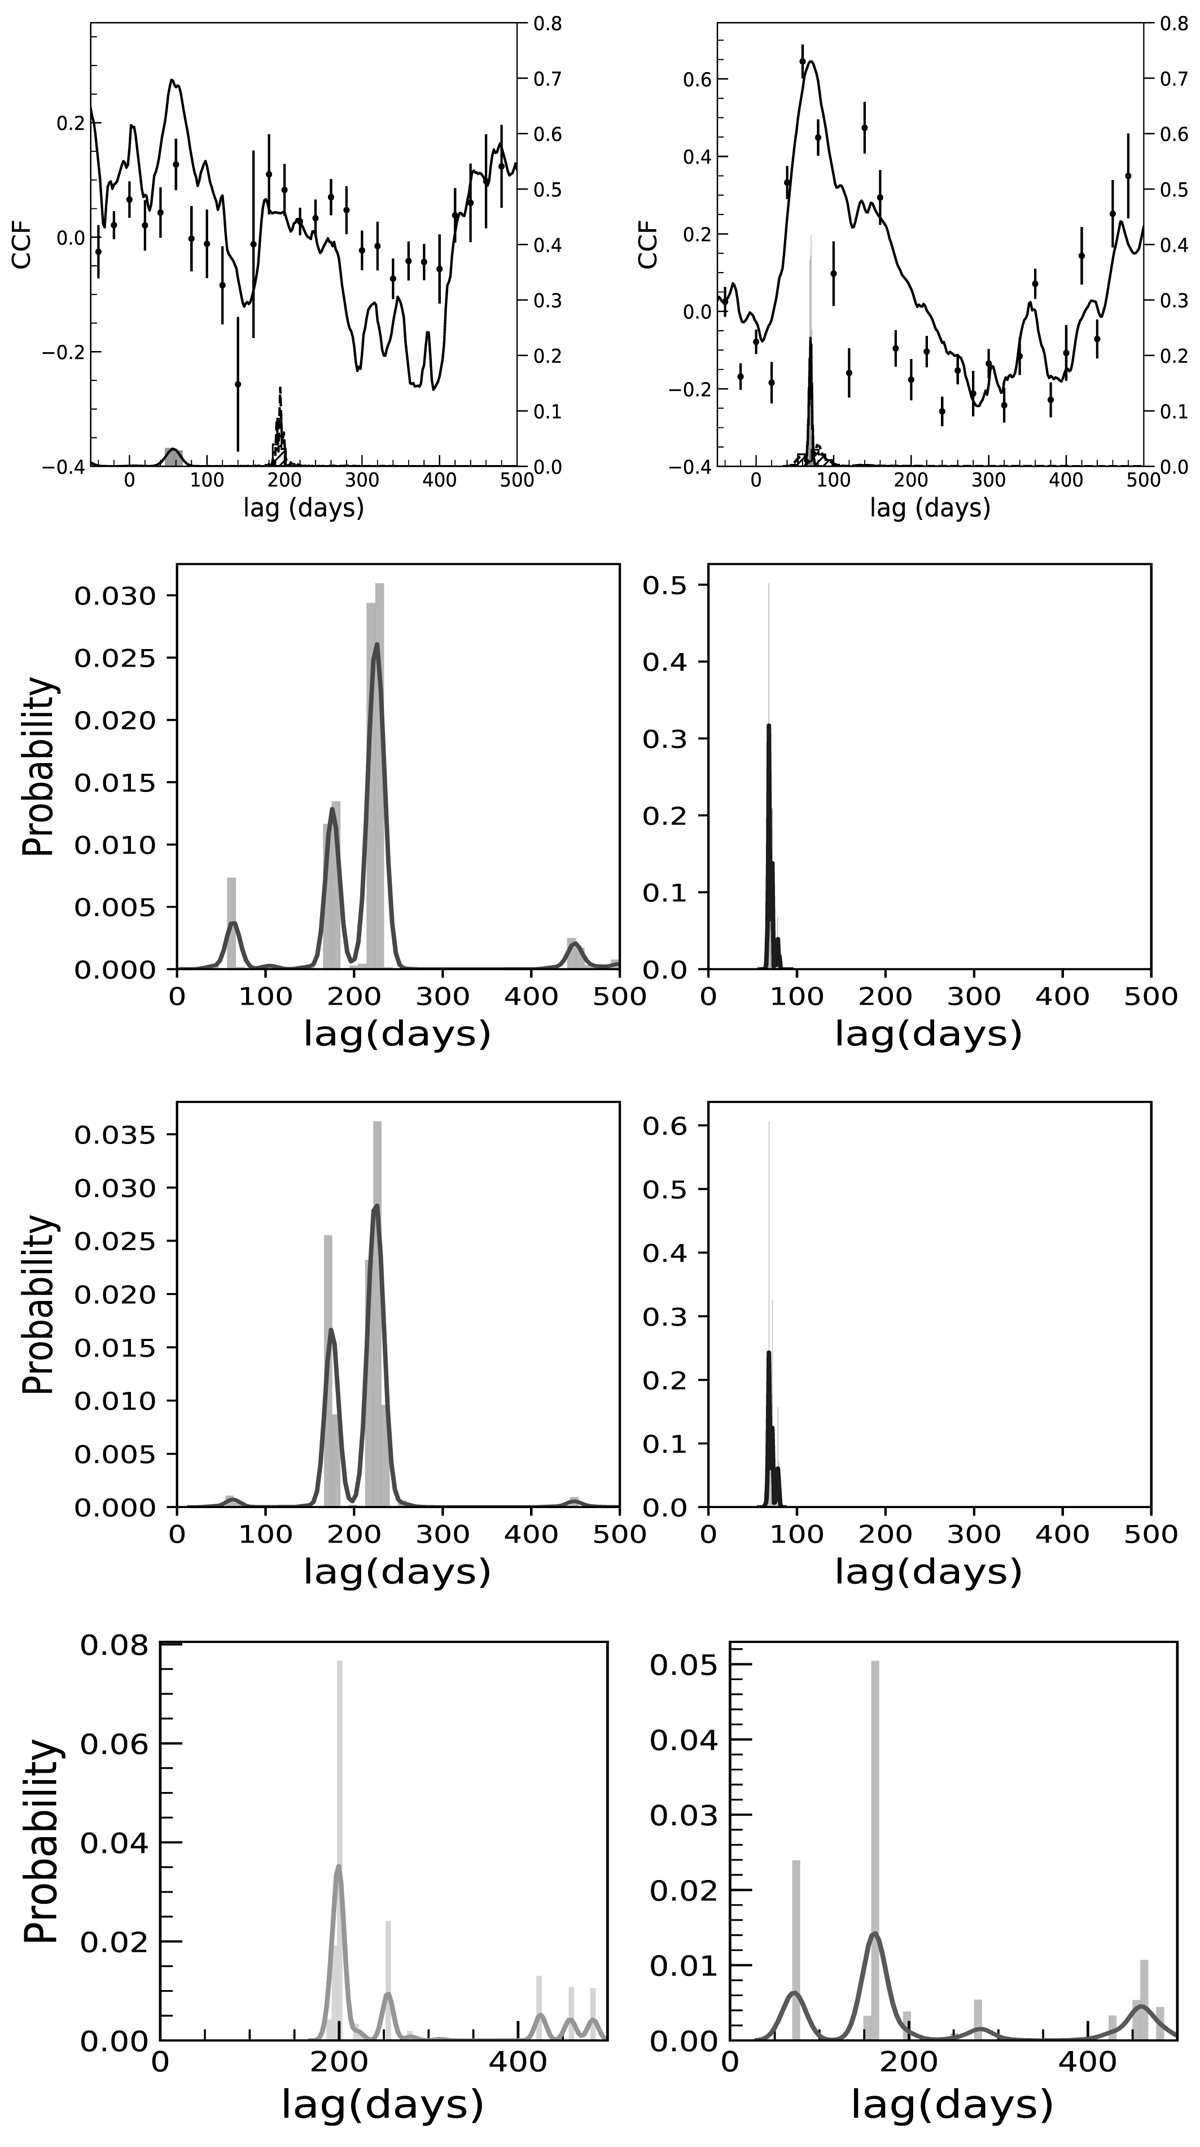
From top to bottom: lag probability distributions obtained from the CCF (ICCF and DCF), von Neumann, Bartels, and JAVELIN methods for the mock continuum vs. mock line light curve with a delay of 200 days (left) and 70 days (right). The lag probability distribution (histogram), along with the smoothed kernel density distribution, is shown in each panel.
Current usage metrics show cumulative count of Article Views (full-text article views including HTML views, PDF and ePub downloads, according to the available data) and Abstracts Views on Vision4Press platform.
Data correspond to usage on the plateform after 2015. The current usage metrics is available 48-96 hours after online publication and is updated daily on week days.
Initial download of the metrics may take a while.