Free Access
Fig. 10.
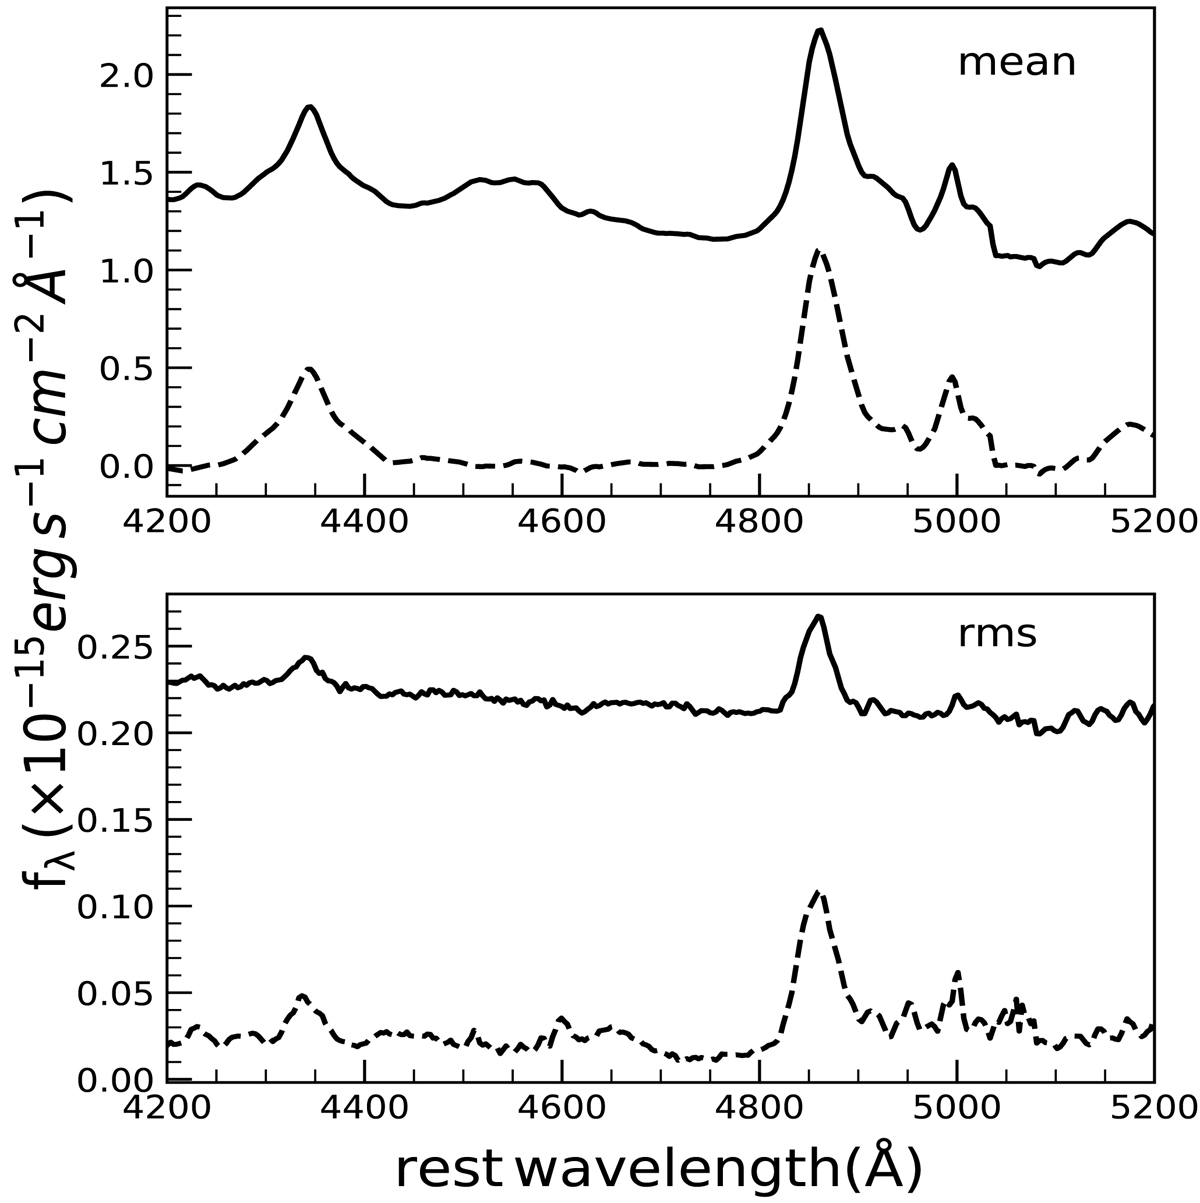
Mean and rms spectra of PKS 1510-089. Top panel: standard mean spectrum (solid line) and a mean spectrum constructed after subtracting the power-law and Fe II (dashed line). Bottom: same as the top panel but for the rms spectrum.
Current usage metrics show cumulative count of Article Views (full-text article views including HTML views, PDF and ePub downloads, according to the available data) and Abstracts Views on Vision4Press platform.
Data correspond to usage on the plateform after 2015. The current usage metrics is available 48-96 hours after online publication and is updated daily on week days.
Initial download of the metrics may take a while.