Free Access
Fig. 1.
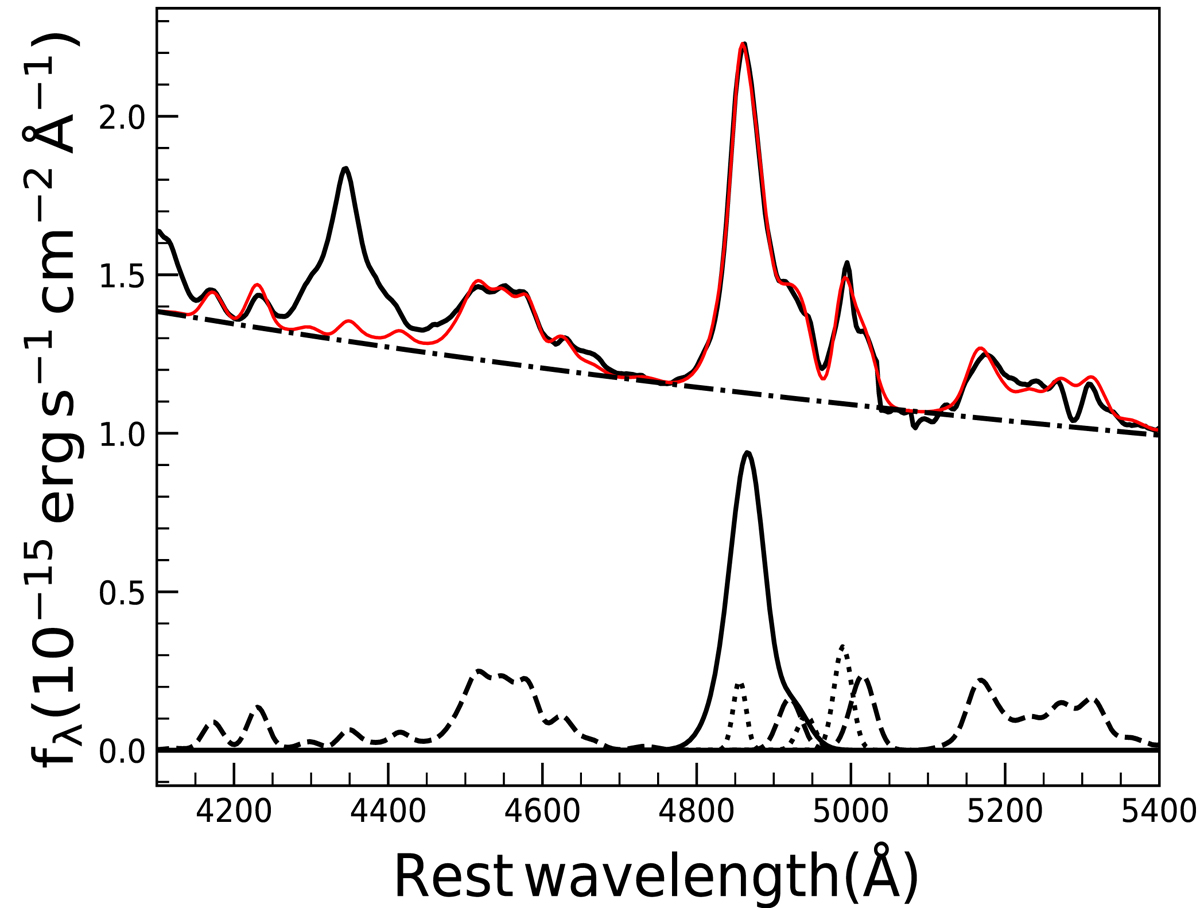
Example of the spectral decomposition of PKS 1510-089. The rest-frame spectrum (black), best-fit model (red), and decomposed AGN power-law component (dashed-dot) are shown along with the Fe II emission (dashed), broad Hβ (solid), and narrow Hβ and [O III] (dotted).
Current usage metrics show cumulative count of Article Views (full-text article views including HTML views, PDF and ePub downloads, according to the available data) and Abstracts Views on Vision4Press platform.
Data correspond to usage on the plateform after 2015. The current usage metrics is available 48-96 hours after online publication and is updated daily on week days.
Initial download of the metrics may take a while.