Fig. 1
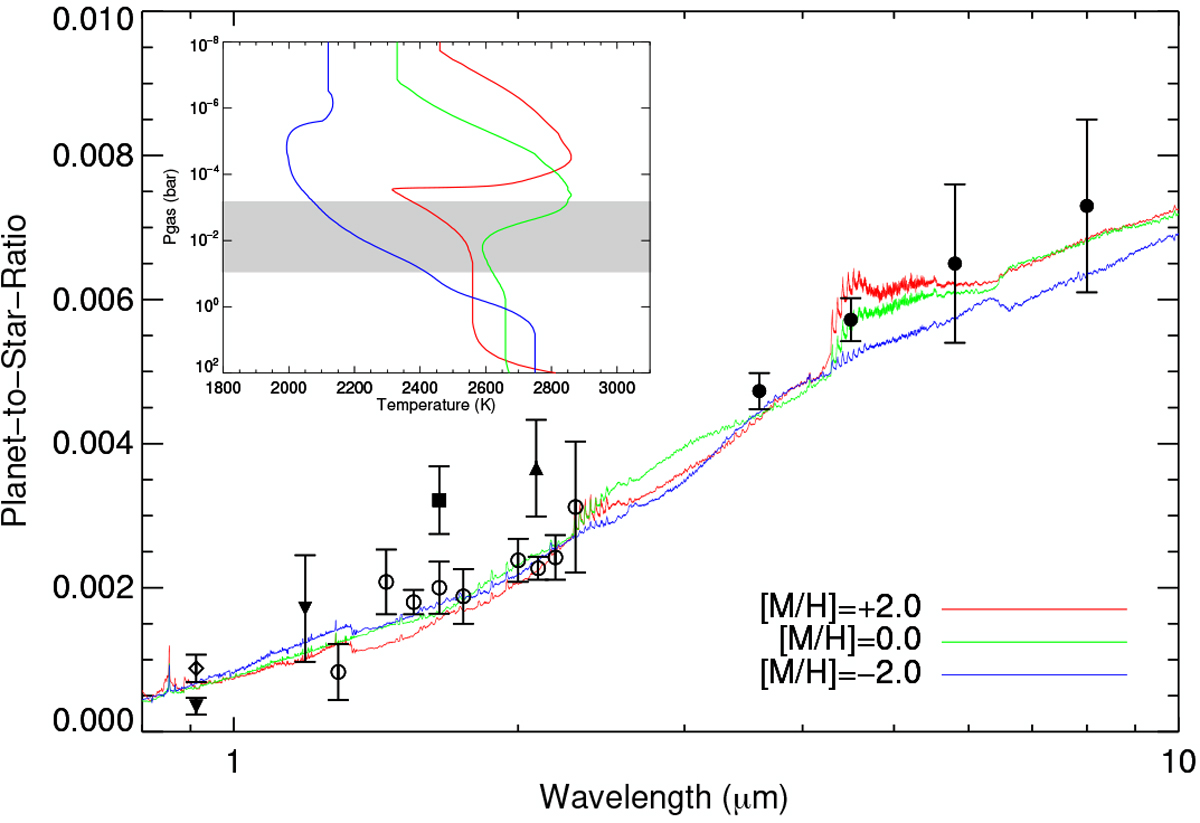
Comparison of observed thermal spectra of WASP-19b with the modelled spectra calculated using PHOENIX (solid line) at different metallicities with an average dayside heat redistribution (f = 0.5). The corresponding temperature-pressure profile is shown in the inset image (the grey shaded region corresponds to the structure inversion). The observed thermal spectrum of WASP-19b presented in this paper is adopted from Anderson et al. (2010, 2013) (filled square and filled circles), Gibson et al. (2010) (filled upward triangle), Bean et al. (2013) (open circles), Burton et al. (2012) (open diamond), and Lendl et al. (2013) (filled downward triangles). The emission features at 4.5 μm are due to CO in the presence of thermal inversion.
Current usage metrics show cumulative count of Article Views (full-text article views including HTML views, PDF and ePub downloads, according to the available data) and Abstracts Views on Vision4Press platform.
Data correspond to usage on the plateform after 2015. The current usage metrics is available 48-96 hours after online publication and is updated daily on week days.
Initial download of the metrics may take a while.