Free Access
Fig. 9.
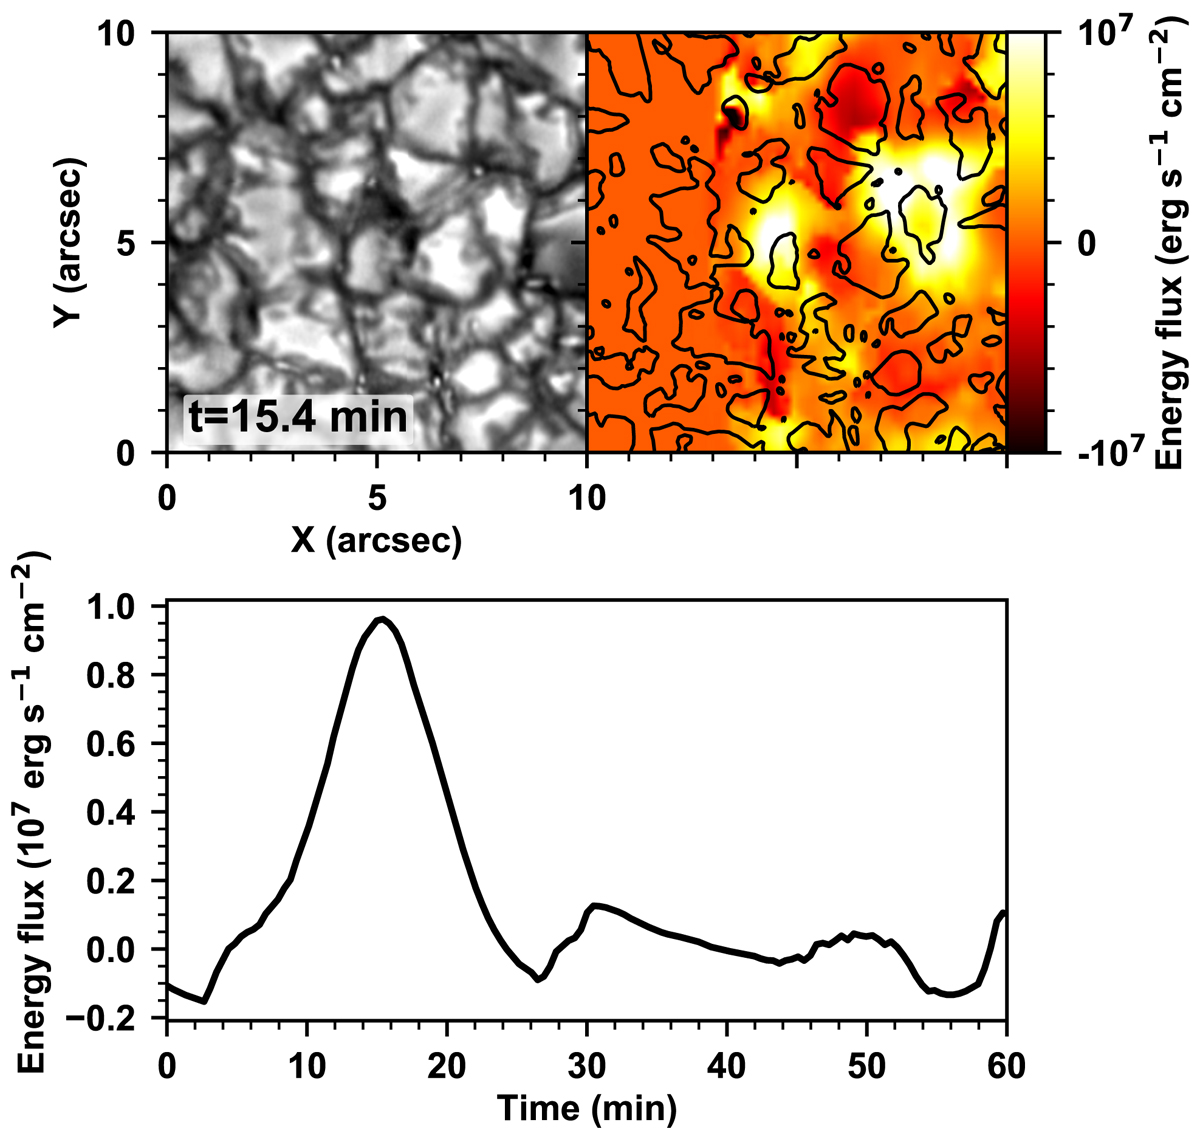
TiO image (top left) and photospheric wave energy flux map (top right) at t = 15.4 min. The contours on the wave energy flux map indicate the granules obtained from the TiO images. The temporal variation of the wave energy flux (bottom) is acquired at the position marked with a cross symbol in Fig. 5.
Current usage metrics show cumulative count of Article Views (full-text article views including HTML views, PDF and ePub downloads, according to the available data) and Abstracts Views on Vision4Press platform.
Data correspond to usage on the plateform after 2015. The current usage metrics is available 48-96 hours after online publication and is updated daily on week days.
Initial download of the metrics may take a while.