Fig. 8.
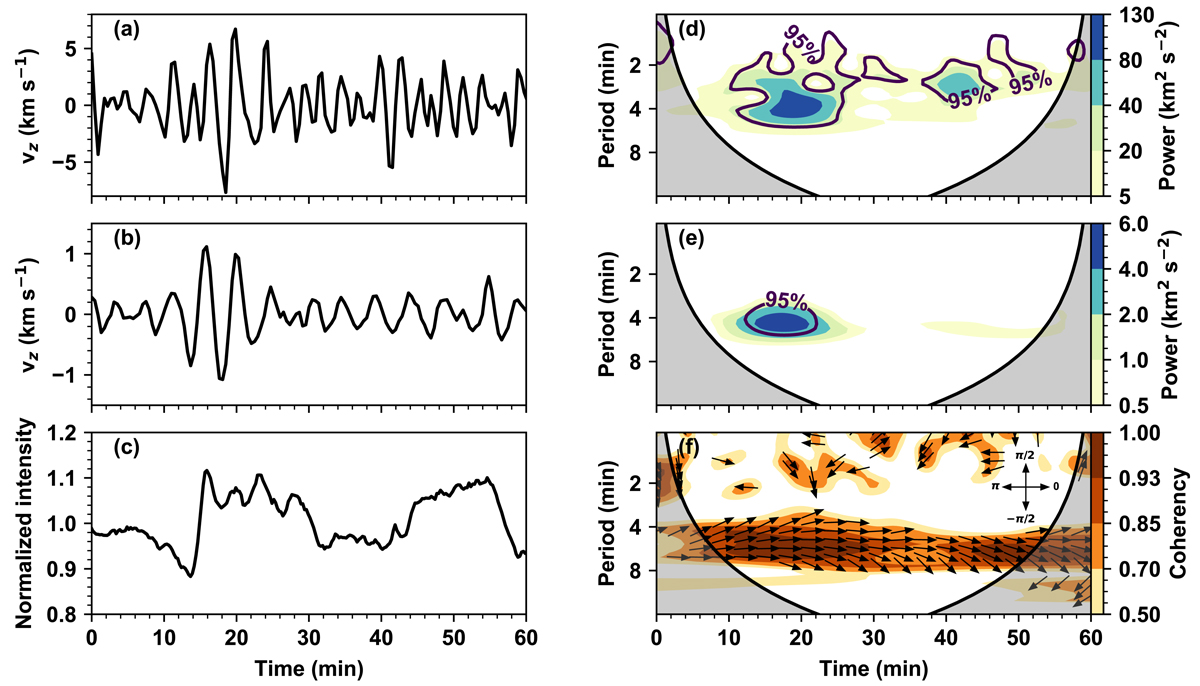
Left: temporal variations of the Hα vertical velocity (a), Ti II vertical velocity (b), and TiO intensity (c) at the position marked with a cross symbol in Fig. 5. Right: wavelet power spectra of Hα vertical velocity (d) and Ti II vertical velocity (e). The purple contours represent the 95% local confidence level. The coherency between the two time series of velocity is shown by contours in (f). The phase differences at the points of coherency above 0.7 are denoted by the directions of the arrows.
Current usage metrics show cumulative count of Article Views (full-text article views including HTML views, PDF and ePub downloads, according to the available data) and Abstracts Views on Vision4Press platform.
Data correspond to usage on the plateform after 2015. The current usage metrics is available 48-96 hours after online publication and is updated daily on week days.
Initial download of the metrics may take a while.