Fig. 5.
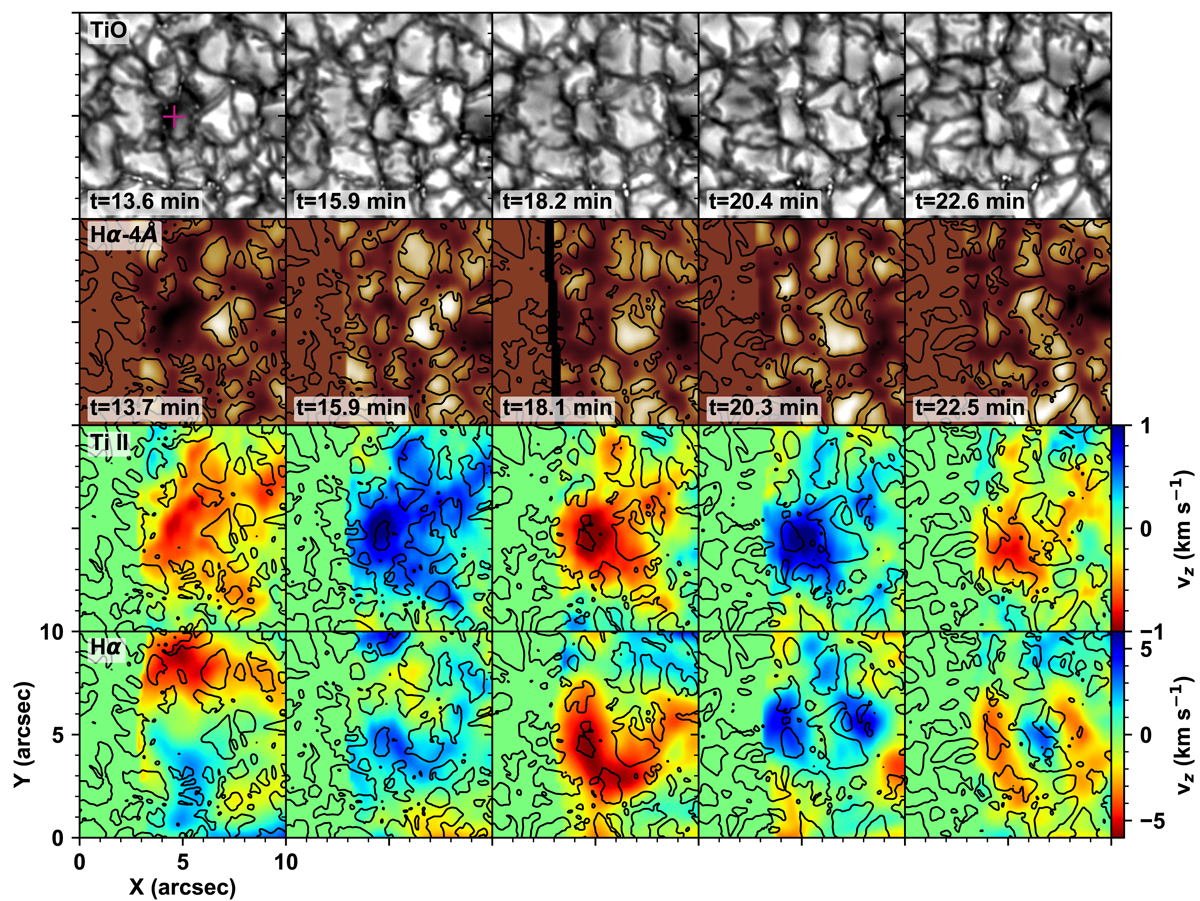
Time series of the TiO images (first row), Hα–4 Å raster images (second row), and vertical velocity maps of the Ti II (third row) and Hα (fourth row). The contours on the Hα–4 Å raster images and the vertical velocity maps indicate the granules obtained from the TiO images. A purple cross symbol in the first TiO image (t = 13.6 min) marks the selected position that was further analyzed and is shown in Figs. 8 and 9.
Current usage metrics show cumulative count of Article Views (full-text article views including HTML views, PDF and ePub downloads, according to the available data) and Abstracts Views on Vision4Press platform.
Data correspond to usage on the plateform after 2015. The current usage metrics is available 48-96 hours after online publication and is updated daily on week days.
Initial download of the metrics may take a while.