Free Access
Fig. 2.
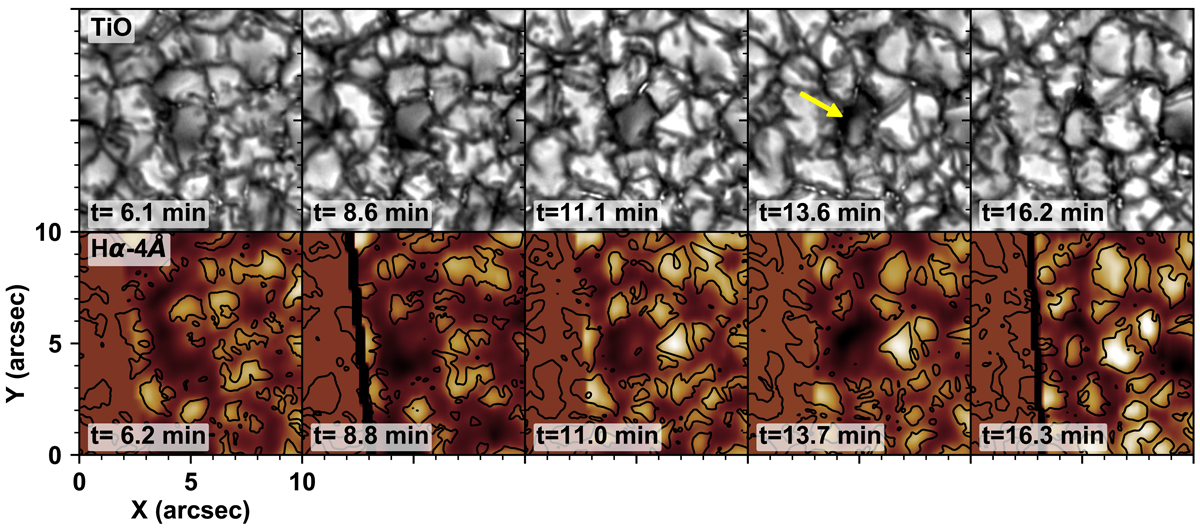
Temporal evolutions of the granule of event 1 in the TiO images (upper panel) and the Hα–4 Å raster images (lower panel). The contours on the Hα–4 Å raster images represent the granules obtained from the TiO images. The yellow arrow indicates the position where the dynamic changes of the granule occurred.
Current usage metrics show cumulative count of Article Views (full-text article views including HTML views, PDF and ePub downloads, according to the available data) and Abstracts Views on Vision4Press platform.
Data correspond to usage on the plateform after 2015. The current usage metrics is available 48-96 hours after online publication and is updated daily on week days.
Initial download of the metrics may take a while.