Fig. A.1.
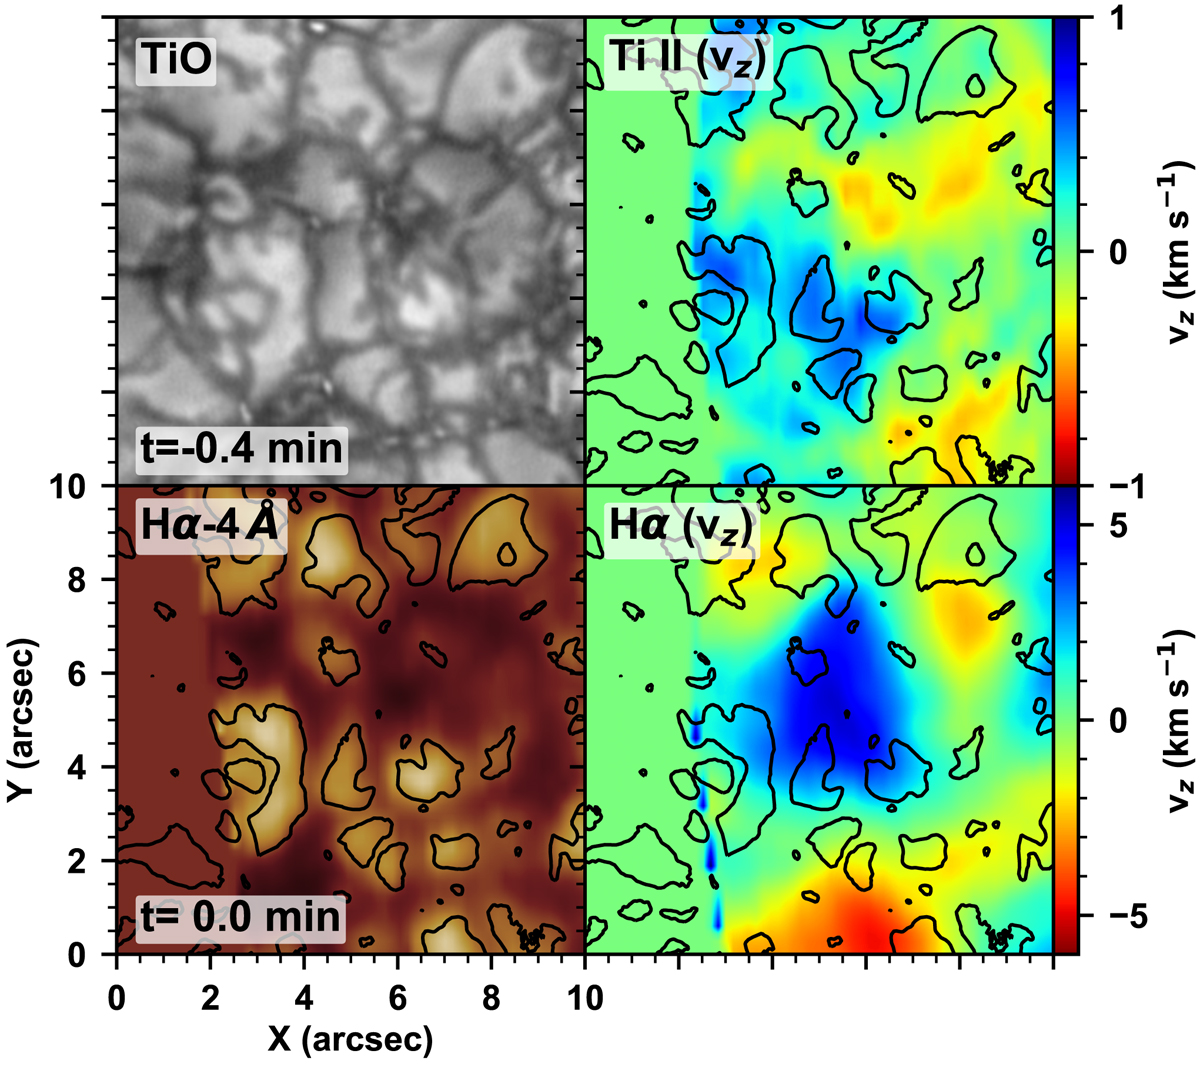
Animation sequence of the TiO images (top left), Hα–4 Å raster images (bottom left), and the Ti II and Hα vertical velocity maps (top and bottom right, respectively). The contours on the Hα–4 Å raster images and the vertical velocity maps indicate the granules obtained from the TiO images. The animation shows the time series of event 1, including the collapse of the granule and the wave excitation. The animation is available online.
Current usage metrics show cumulative count of Article Views (full-text article views including HTML views, PDF and ePub downloads, according to the available data) and Abstracts Views on Vision4Press platform.
Data correspond to usage on the plateform after 2015. The current usage metrics is available 48-96 hours after online publication and is updated daily on week days.
Initial download of the metrics may take a while.