Fig. 10.
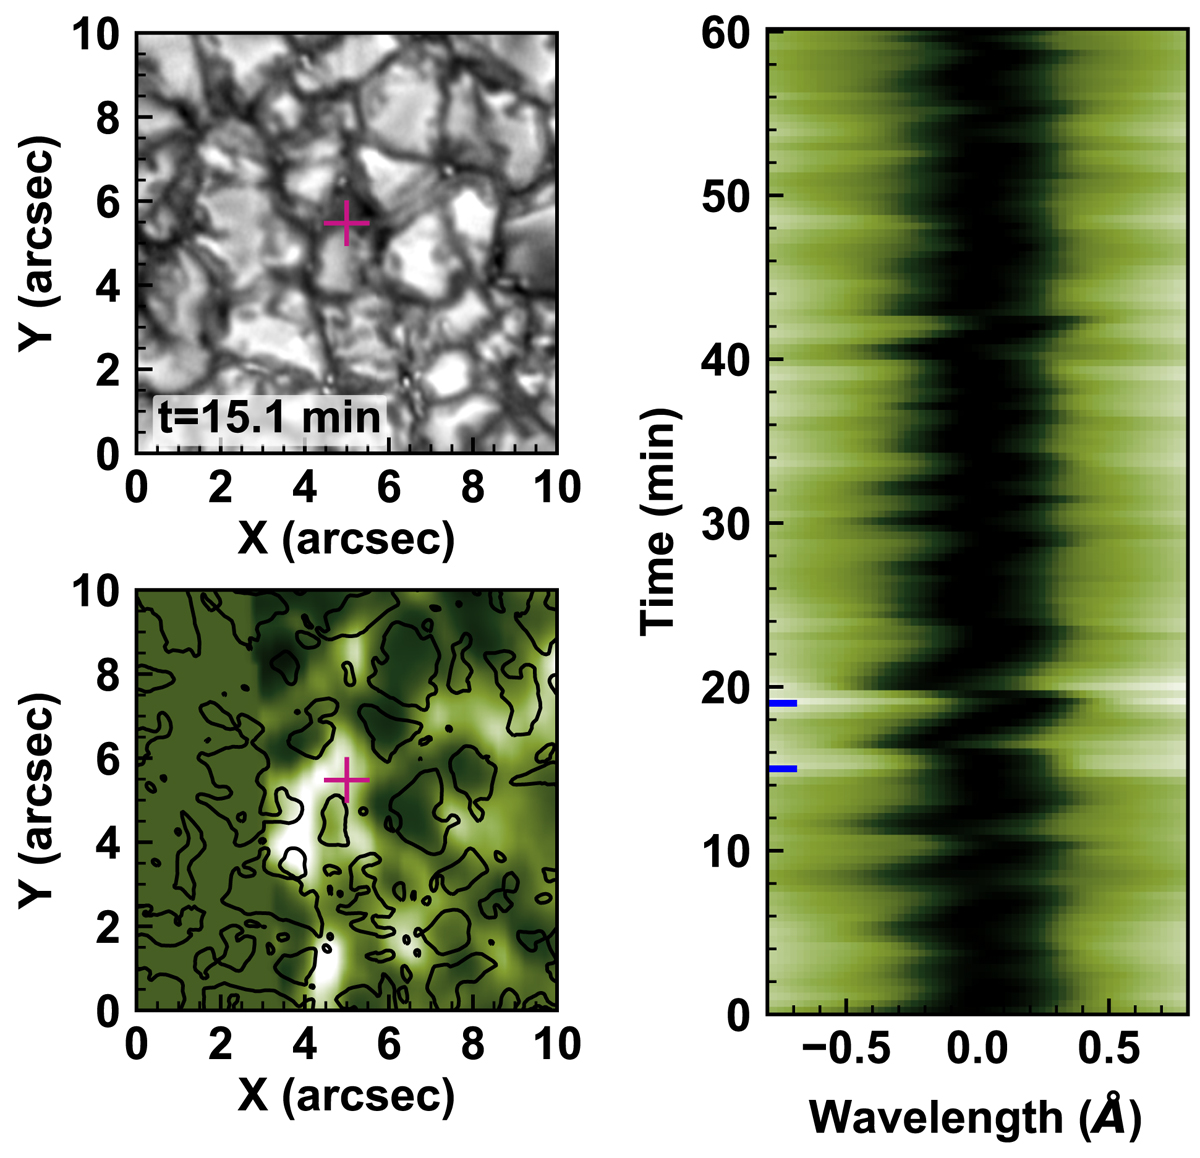
TiO image (top left) and the Ca II–0.5 Å raster image (bottom left) at t = 15.1 min. The wavelength-time (λ − t) plot of the Ca II 8542 Å line intensity (right) was taken from the position marked with a purple cross symbol on the Ca II–0.5 Å raster image. In the λ − t plot, two brightenings are marked with blue horizontal lines at t = 15 and t = 19 min.
Current usage metrics show cumulative count of Article Views (full-text article views including HTML views, PDF and ePub downloads, according to the available data) and Abstracts Views on Vision4Press platform.
Data correspond to usage on the plateform after 2015. The current usage metrics is available 48-96 hours after online publication and is updated daily on week days.
Initial download of the metrics may take a while.