Fig. 1.
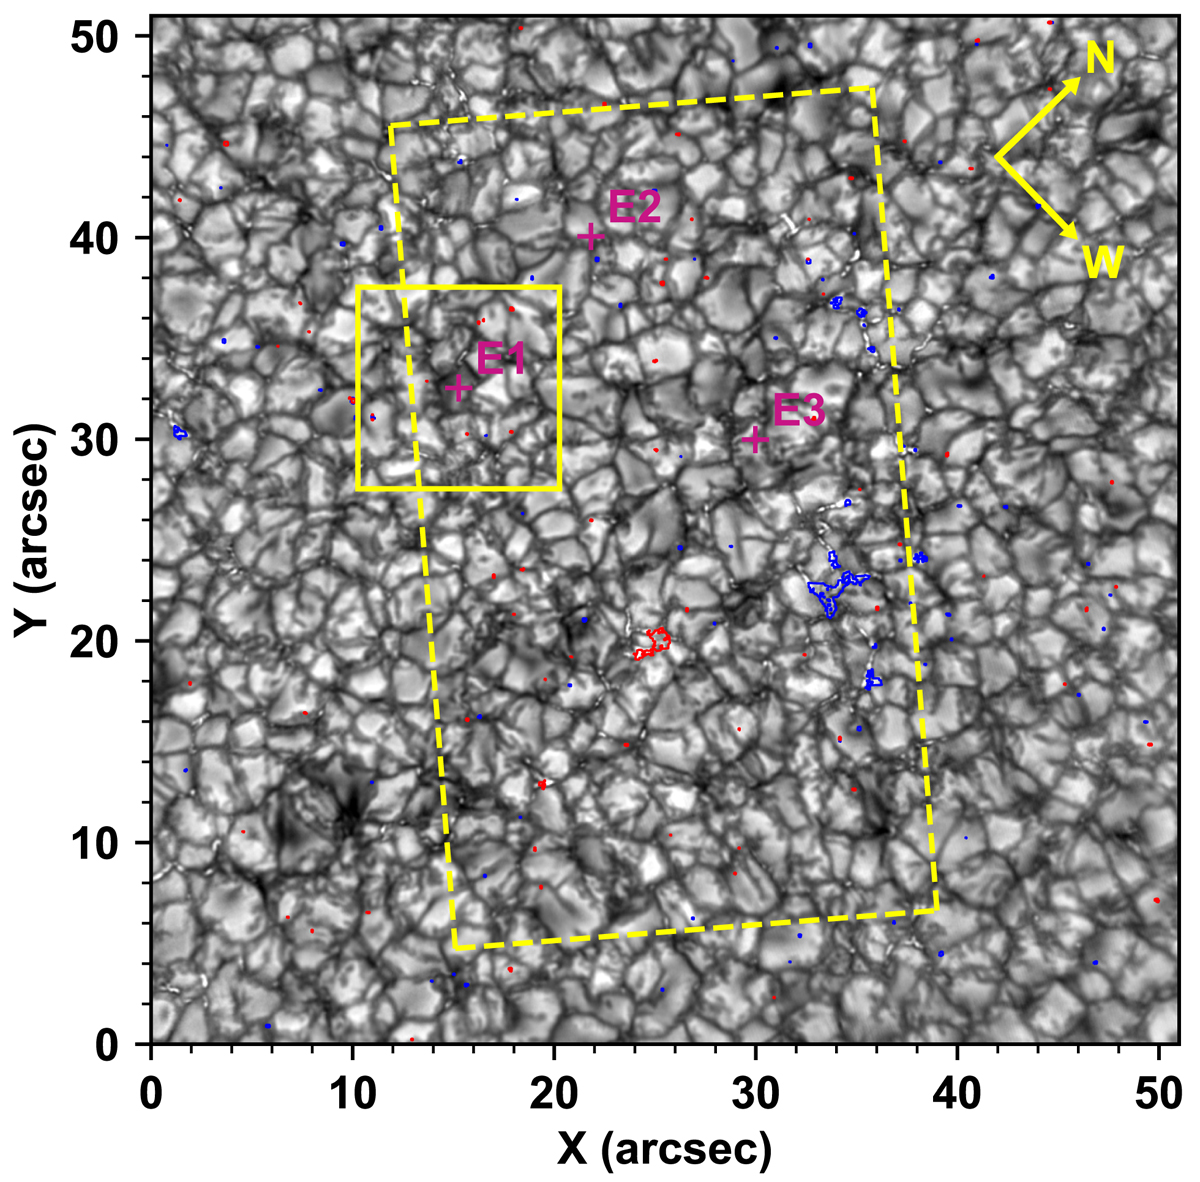
Photospheric TiO 7057 Å broadband filter image of a quiet Sun region taken at 18:03:56 UT (t = 11.9 min). The dashed yellow line rectangle represents the FOV of the FISS. The small yellow square indicates one of our regions of interest, and the size of the square is 10″ × 10″. The locations of each event are marked with purple cross symbols and annotated as E1, E2, and E3. The contours represent the line of sight (LOS) magnetogram obtained from the Near-Infrared Imaging Spectro-polarimeter (NIRIS) installed on the GST. The blue and red contours represent LOS magnetic field strengths of −100 G and 100 G, respectively.
Current usage metrics show cumulative count of Article Views (full-text article views including HTML views, PDF and ePub downloads, according to the available data) and Abstracts Views on Vision4Press platform.
Data correspond to usage on the plateform after 2015. The current usage metrics is available 48-96 hours after online publication and is updated daily on week days.
Initial download of the metrics may take a while.