Fig. B.1
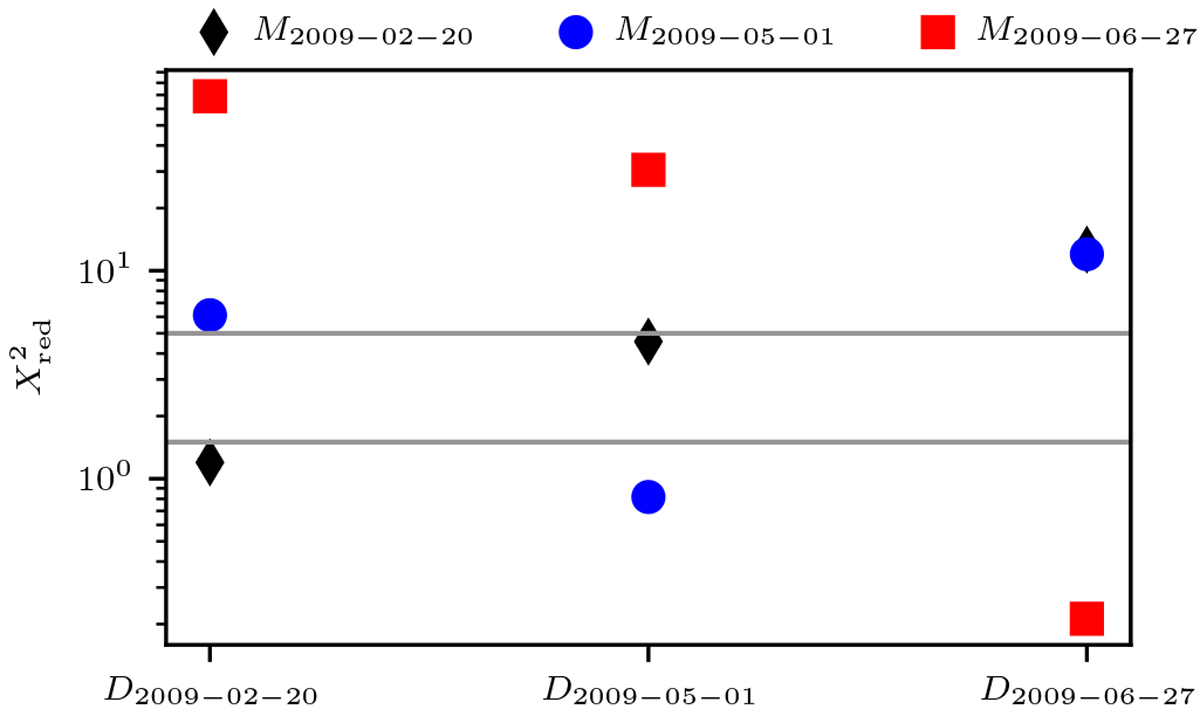
Illustration of the analysis approach based on Gaussian model fitting using the example of interferometric observations obtained with AMBER in 20 February 2009, 1 May 2009, and 27 June 2009 for V856 Sco (see Appendix B for details). We plot
![]() to compare the Gaussian best-fit models M2009-02-20
(black diamonds), M2009-05-01
(blue dots), and M2009-06-27
(red squares) to the interferometric data (visibilities and phases; D2009-02-20,
D2009-05-01, and D2009-06-27) from the different epochs. The upper and lower
to compare the Gaussian best-fit models M2009-02-20
(black diamonds), M2009-05-01
(blue dots), and M2009-06-27
(red squares) to the interferometric data (visibilities and phases; D2009-02-20,
D2009-05-01, and D2009-06-27) from the different epochs. The upper and lower ![]() -limits indicating temporal variability when comparing data with best-fit models of the same and different epochs are plotted as gray solid lines.
-limits indicating temporal variability when comparing data with best-fit models of the same and different epochs are plotted as gray solid lines.
Current usage metrics show cumulative count of Article Views (full-text article views including HTML views, PDF and ePub downloads, according to the available data) and Abstracts Views on Vision4Press platform.
Data correspond to usage on the plateform after 2015. The current usage metrics is available 48-96 hours after online publication and is updated daily on week days.
Initial download of the metrics may take a while.