Fig. 6
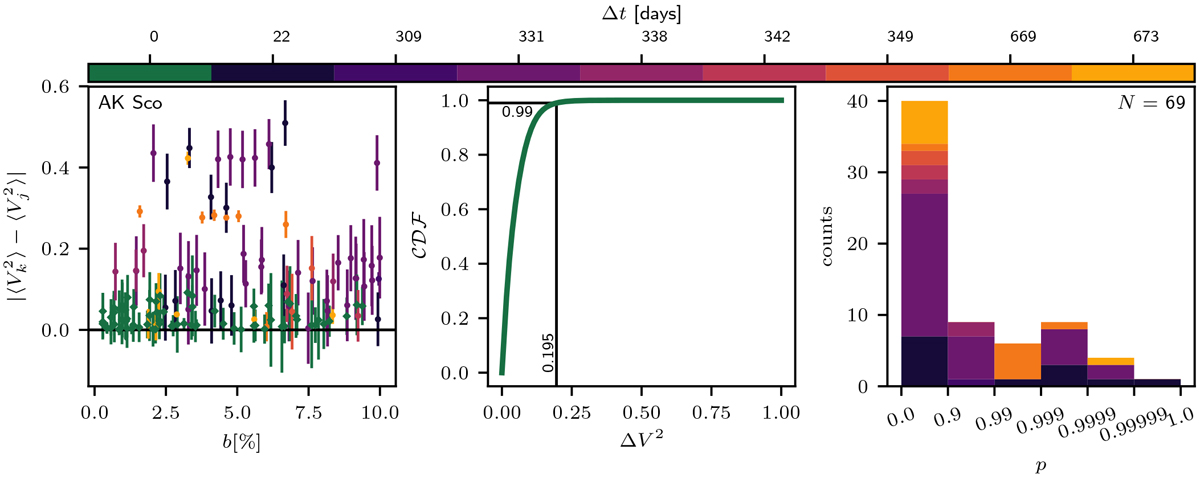
Illustration of the analysis approach based on the comparison of visibilities taking into account estimates for typical variations due to moderate baseline deviations as described in Sect. 4.1 by the example of AK Sco. Left: differences of all pairs of squared visibilities obtained using baselines with a maximum difference of 10% with PIONIER. Differences calculated for two squared visibilities obtained within the same night are plotted as green diamonds. The points represent differences calculated for two squared visibilities measured on different nights with a time lag Δt indicated by the color bar. Middle: cumulative distribution function calculated from the differences of the squared visibilities with Δt < 12 h (Eq. (11)). The black lines indicate the probability of 0.99 to obtain a visibility difference below 0.195 when expecting the difference to be affected solely by the baseline deviation and not by temporal variability. Right: histogram of the measure p (Eq. (12)), indicating the probability of the 69 visibility differences with Δt > 12 h (Δt indicated bythe color) to be affected by temporal variations in the brightness distribution.
Current usage metrics show cumulative count of Article Views (full-text article views including HTML views, PDF and ePub downloads, according to the available data) and Abstracts Views on Vision4Press platform.
Data correspond to usage on the plateform after 2015. The current usage metrics is available 48-96 hours after online publication and is updated daily on week days.
Initial download of the metrics may take a while.