Fig. 2
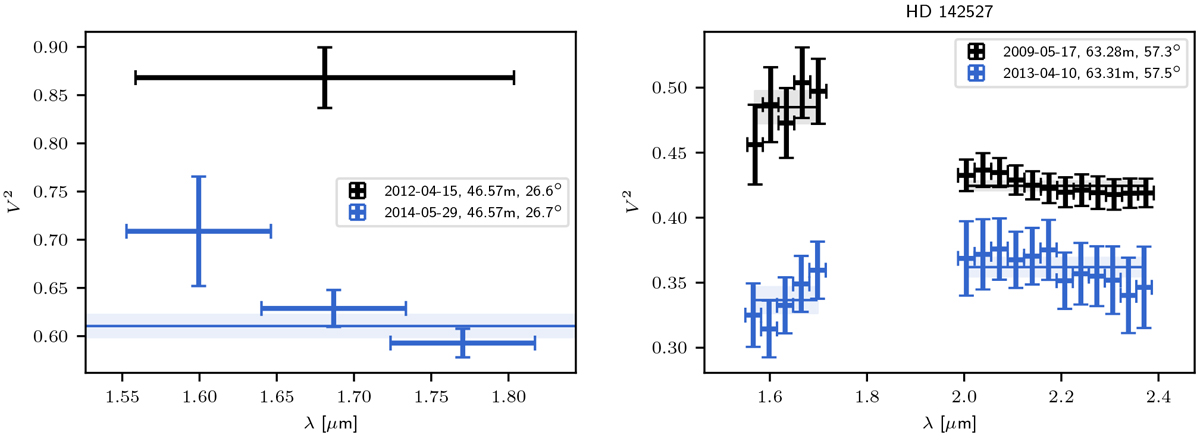
Squared visibilities obtained for HD 142527. Left: squared visibilities obtained with PIONIER on two nights using equal baselines. Right: squared visibilities obtained with AMBER on two other nights using equal baselines. The error bars in vertical direction give the uncertainties of the squared visibilities. In a horizontal direction, the bars indicate the spectral bins. Spectrally resolved measurements are averaged according to Eq. (4), where the mean values are plotted as solid lines and the corresponding uncertainties (Eq. (5)) as shaded rectangles.
Current usage metrics show cumulative count of Article Views (full-text article views including HTML views, PDF and ePub downloads, according to the available data) and Abstracts Views on Vision4Press platform.
Data correspond to usage on the plateform after 2015. The current usage metrics is available 48-96 hours after online publication and is updated daily on week days.
Initial download of the metrics may take a while.