Free Access
Fig. 6.
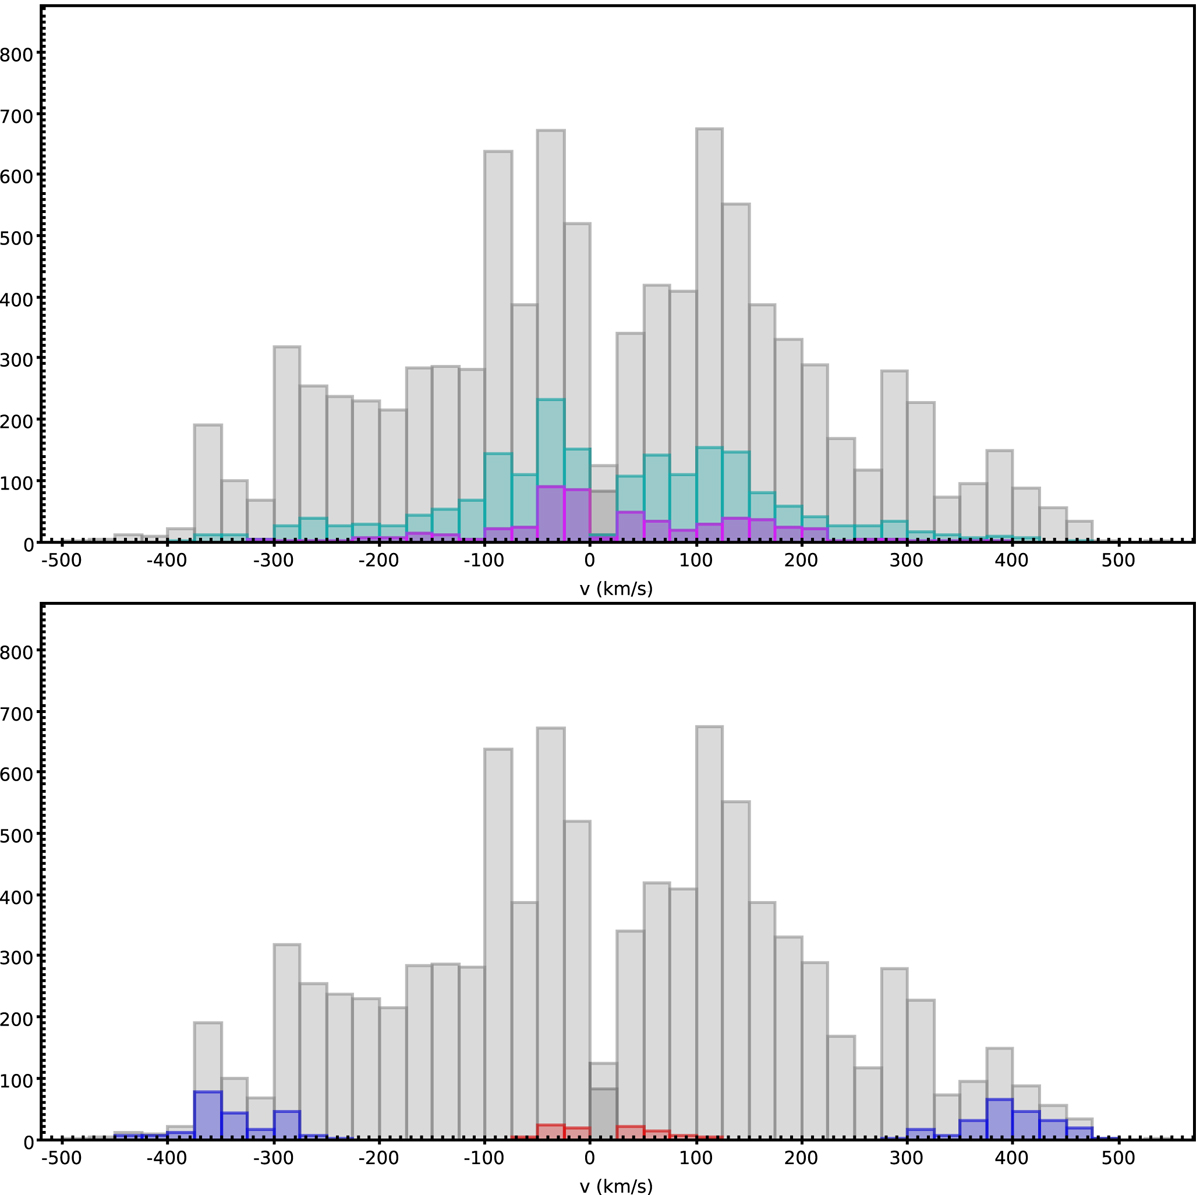
Histograms as a function of the velocity derived from the wings of the Hα line for the spectra with S/N > 10. Upper panel: flagged spectra with spurious absorption doublets are highlighted in light blue for [SII] and in magenta for [NII]. Lower panel: good (blue) and bad (red) cases are highlighted.
Current usage metrics show cumulative count of Article Views (full-text article views including HTML views, PDF and ePub downloads, according to the available data) and Abstracts Views on Vision4Press platform.
Data correspond to usage on the plateform after 2015. The current usage metrics is available 48-96 hours after online publication and is updated daily on week days.
Initial download of the metrics may take a while.