Fig. 6.
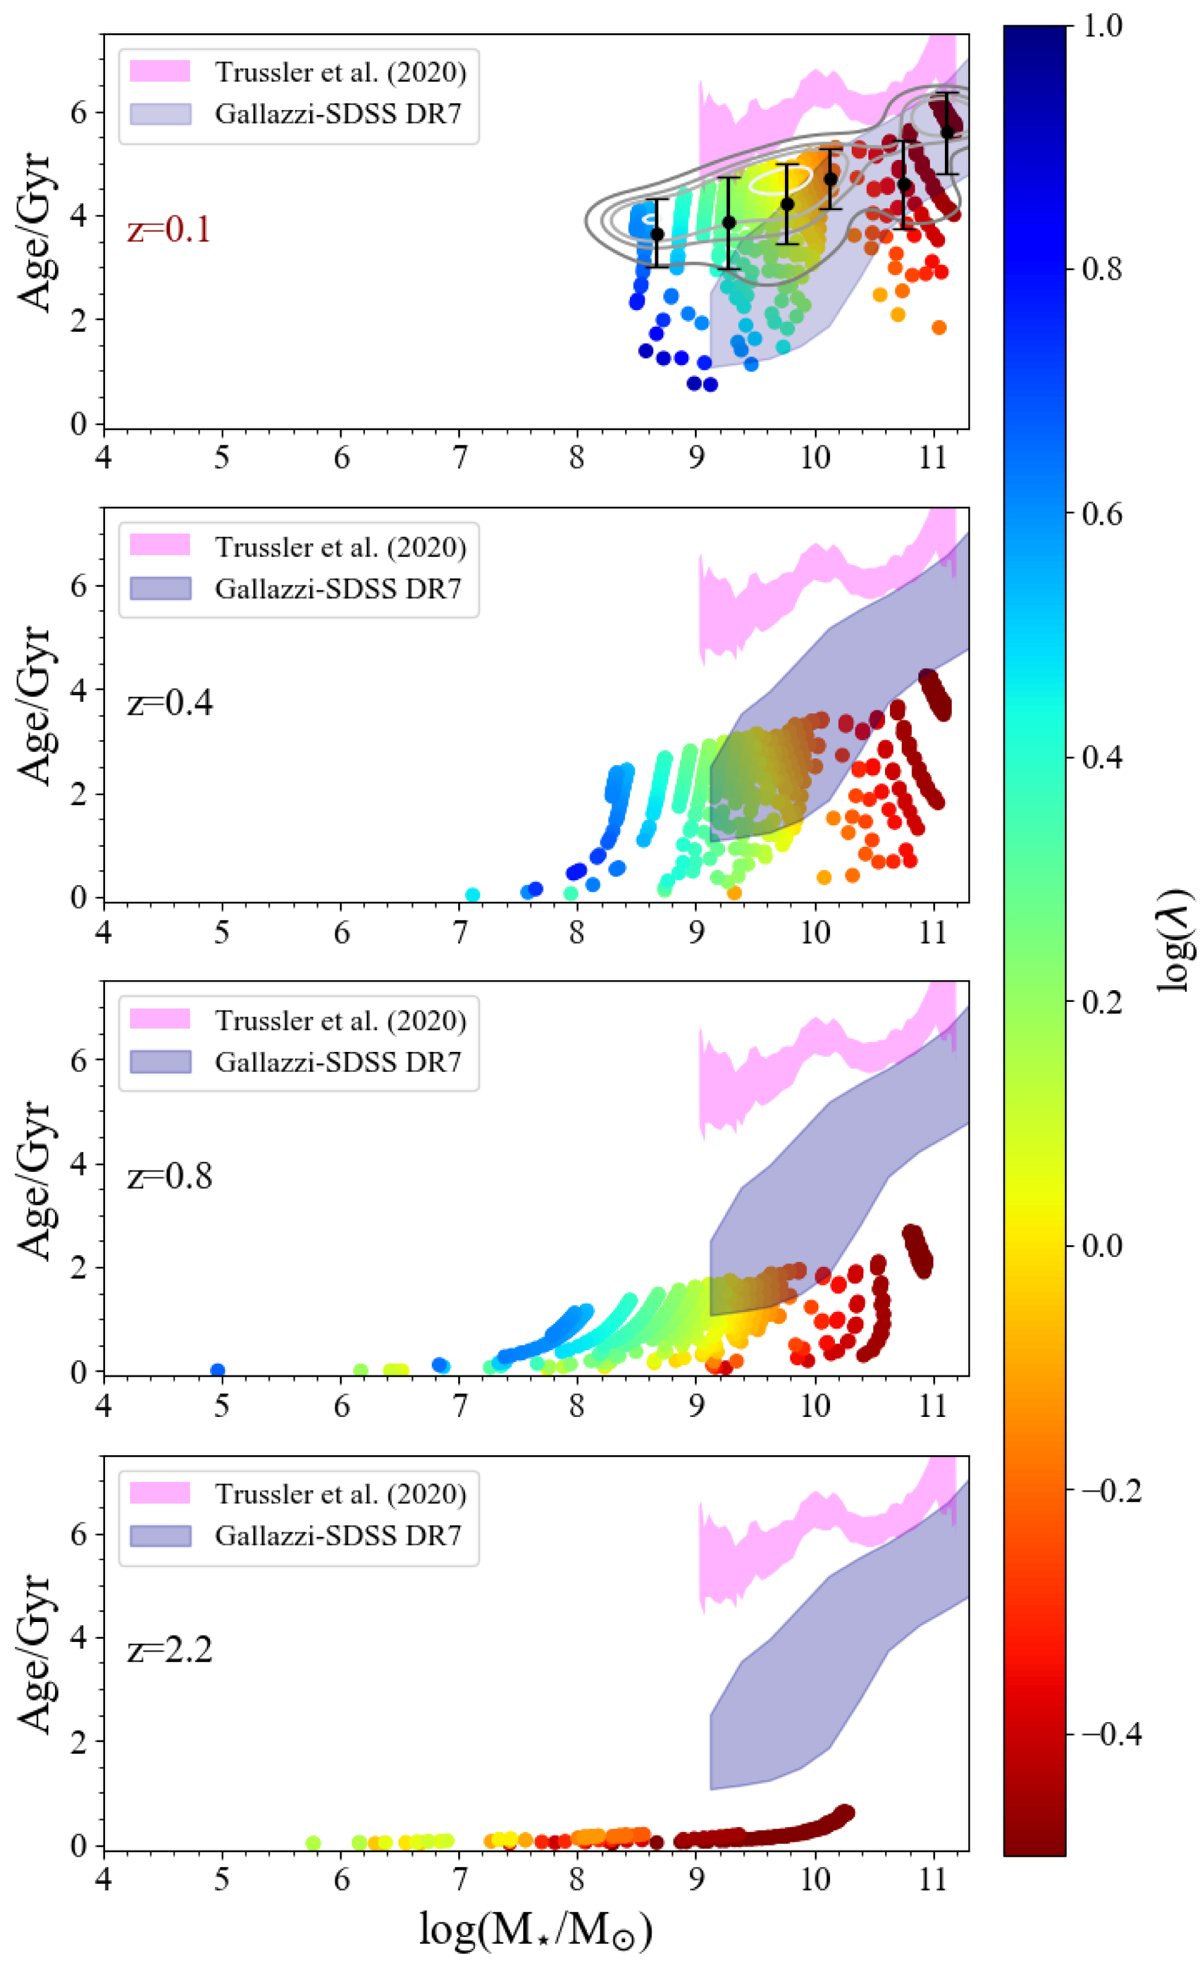
Backward evolution of the mass-weighted age vs. stellar mass relation (computed at z = 2.2, z = 0.8, and z = 0.4) for the galaxies which lie on the MZR of Kewley & Ellison (2008) and on the MSR as derived by Peng et al. (2010). The color-coding indicates the loading factor parameter λ. The white-grey contour lines indicate isodensity contours. The shaded pink area indicates the observational data by Trussler et al. (2020) for local star-forming galaxies (0.02 < z < 0.085), whereas the shaded blue area stands for the relation obtained using the SDSS-DR7 catalog of mass-weighted ages estimated as in Gallazzi et al. (2008) using the same selection of star-forming galaxies as Trussler et al. (2020). In the upper panel, the black points are the mean age values of the simulated galaxies at redshift z ∼ 0.1 inside bins of size 0.5 log(M⋆/M⊙) and the error bars are the standard deviations.
Current usage metrics show cumulative count of Article Views (full-text article views including HTML views, PDF and ePub downloads, according to the available data) and Abstracts Views on Vision4Press platform.
Data correspond to usage on the plateform after 2015. The current usage metrics is available 48-96 hours after online publication and is updated daily on week days.
Initial download of the metrics may take a while.